pax_global_header00006660000000000000000000000064152044612650014517gustar00rootroot0000000000000052 comment=b3a23a2f7399ba1e345106bc17fbe423755926c9 red-data-tools-YouPlot-08da630/000077500000000000000000000000001520446126500162765ustar00rootroot00000000000000red-data-tools-YouPlot-08da630/.github/000077500000000000000000000000001520446126500176365ustar00rootroot00000000000000red-data-tools-YouPlot-08da630/.github/dependabot.yml000066400000000000000000000001561520446126500224700ustar00rootroot00000000000000version: 2 updates: - package-ecosystem: "github-actions" directory: "/" schedule: interval: "weekly" red-data-tools-YouPlot-08da630/.github/workflows/000077500000000000000000000000001520446126500216735ustar00rootroot00000000000000red-data-tools-YouPlot-08da630/.github/workflows/ci.yml000066400000000000000000000007521520446126500230150ustar00rootroot00000000000000name: test on: [push, pull_request, workflow_dispatch] jobs: build: name: ${{ matrix.os }} Ruby ${{ matrix.ruby }} runs-on: ${{ matrix.os }}-latest strategy: matrix: os: ["ubuntu", "macos"] ruby: ["2.7", "3.0", "3.1", "3.2", "3.3", "3.4", "4.0", "head"] steps: - uses: actions/checkout@v6 - uses: ruby/setup-ruby@v1 with: ruby-version: ${{ matrix.ruby }} bundler-cache: true - run: bundle exec rake test red-data-tools-YouPlot-08da630/.github/workflows/doc.yml000066400000000000000000000007431520446126500231670ustar00rootroot00000000000000name: doc on: push: branches: - main jobs: build: runs-on: ubuntu-latest steps: - uses: actions/checkout@v6 - uses: ruby/setup-ruby@v1 with: ruby-version: ruby - name: Generate document run: gem install -N yard && yard doc - name: Publish Documentation on GitHub Pages uses: peaceiris/actions-gh-pages@v4 with: github_token: ${{ secrets.GITHUB_TOKEN }} publish_dir: ./doc red-data-tools-YouPlot-08da630/.gitignore000066400000000000000000000001311520446126500202610ustar00rootroot00000000000000/.bundle/ /.yardoc /_yardoc/ /coverage/ /doc/ /pkg/ /spec/reports/ /tmp/ /vendor/ *.lock red-data-tools-YouPlot-08da630/Gemfile000066400000000000000000000004571520446126500175770ustar00rootroot00000000000000# frozen_string_literal: true source 'https://rubygems.org' # Specify your gem's dependencies in youplot.gemspec gemspec group :development do if RUBY_VERSION >= '3.0' gem 'steep', require: false gem 'typeprof' end end group :test do gem 'rake' gem 'simplecov' gem 'test-unit' end red-data-tools-YouPlot-08da630/LICENSE.txt000066400000000000000000000021231520446126500201170ustar00rootroot00000000000000The MIT License (MIT) Copyright (c) 2020 kojix2 Copyright (c) 2025 Red Data Tools Permission is hereby granted, free of charge, to any person obtaining a copy of this software and associated documentation files (the "Software"), to deal in the Software without restriction, including without limitation the rights to use, copy, modify, merge, publish, distribute, sublicense, and/or sell copies of the Software, and to permit persons to whom the Software is furnished to do so, subject to the following conditions: The above copyright notice and this permission notice shall be included in all copies or substantial portions of the Software. THE SOFTWARE IS PROVIDED "AS IS", WITHOUT WARRANTY OF ANY KIND, EXPRESS OR IMPLIED, INCLUDING BUT NOT LIMITED TO THE WARRANTIES OF MERCHANTABILITY, FITNESS FOR A PARTICULAR PURPOSE AND NONINFRINGEMENT. IN NO EVENT SHALL THE AUTHORS OR COPYRIGHT HOLDERS BE LIABLE FOR ANY CLAIM, DAMAGES OR OTHER LIABILITY, WHETHER IN AN ACTION OF CONTRACT, TORT OR OTHERWISE, ARISING FROM, OUT OF OR IN CONNECTION WITH THE SOFTWARE OR THE USE OR OTHER DEALINGS IN THE SOFTWARE. red-data-tools-YouPlot-08da630/README.md000066400000000000000000000244331520446126500175630ustar00rootroot00000000000000

Build Status Gem Version Docs Stable The MIT License YouPlot is a command line tool that draws plots on the terminal. :bar_chart: Powered by [UnicodePlot](https://github.com/red-data-tools/unicode_plot.rb)
## Installation ``` brew install youplot ``` ``` gem install youplot ``` ``` nix shell nixpkgs#youplot ``` ``` guix install youplot ``` ``` conda install -c conda-forge ruby conda install -c conda-forge compilers gem install youplot ``` :crystal_ball: [YouPlot2](https://github.com/red-data-tools/YouPlot2) - Experimental project with pre-built binaries ## Quick Start barplot histogram scatter density boxplot `uplot [options] ` ### barplot ```sh curl -sL https://git.io/ISLANDScsv \ | sort -nk2 -t, \ | tail -n15 \ | uplot bar -d, -t "Areas of the World's Major Landmasses" ```

barplot

For offline users: sorts files in a directory by size and shows a bar graph. ```sh ls -l | awk '{print $9, $5}' | sort -nk 2 | uplot bar -d ' ' ``` ### histogram ```sh echo -e "from numpy import random;" \ "n = random.randn(10000);" \ "print('\\\n'.join(str(i) for i in n))" \ | python3 \ | uplot hist --nbins 20 ```

histogram

### lineplot ```sh curl -sL https://git.io/AirPassengers \ | cut -f2,3 -d, \ | uplot line -d, -w 50 -h 15 -t AirPassengers --xlim 1950,1960 --ylim 0,600 ```

lineplot

For offline users: calculates sin values from 0 to 2*pi and plots a sine wave. ```sh python3 - <<'PY' | uplot line from math import sin, pi for i in range(101): print(f"{i*pi/50}\t{sin(i*pi/50)}") PY ``` ### scatter ```sh curl -sL https://git.io/IRIStsv \ | cut -f1-4 \ | uplot scatter -H -t IRIS ```

scatter

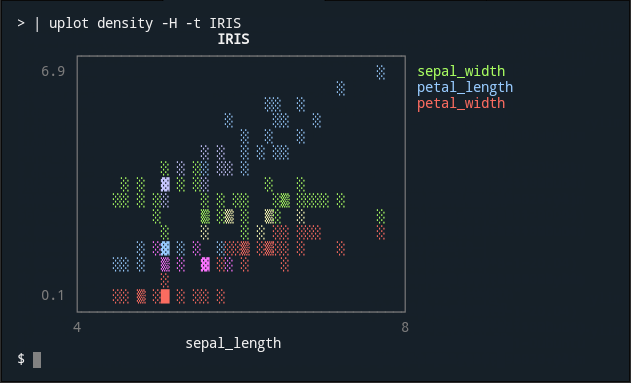
For offline users: ```sh cat test/fixtures/iris.csv | cut -f1-4 -d, | uplot scatter -H -d, -t IRIS ``` ### density ```sh curl -sL https://git.io/IRIStsv \ | cut -f1-4 \ | uplot density -H -t IRIS ```

density

For offline users: ```sh cat test/fixtures/iris.csv | cut -f1-4 -d, | uplot density -H -d, -t IRIS ``` ### boxplot ```sh curl -sL https://git.io/IRIStsv \ | cut -f1-4 \ | uplot boxplot -H -t IRIS ```

boxplot

For offline users: ```sh cat test/fixtures/iris.csv | cut -f1-4 -d, | uplot boxplot -H -d, -t IRIS ``` ### count Count processes by user ID. ```sh ps aux | awk '{print $1}' | uplot count ``` Count the number of chromosomes where genes are located. ```sh cat gencode.v35.annotation.gff3 \ | grep -v '#' | grep 'gene' | cut -f1 \ | uplot count -t "The number of human gene annotations per chromosome" -c blue ```

count

* [GENCODE - Human Release](https://www.gencodegenes.org/human/) Note: `count` is not very fast because it runs in a Ruby script. This is fine in most cases, as long as the data size is small. If you want to visualize huge data, it is faster to use a combination of common Unix commands as shown below. ```sh cat gencode.v35.annotation.gff3 | grep -v '#' | grep 'gene' | cut -f1 \ | sort | uniq -c | sort -nrk1 \ | uplot bar --fmt yx -d ' ' -t "The number of human gene annotations per chromosome" -c blue ``` ## Usage ### Commands `uplot` is the shortened form of `youplot`. You can use either. | Command | Description | | ---------------------------------------------- | --------------------------------- | | `cat data.tsv \| uplot [options]` | Take input from stdin | | `uplot [options] data.tsv ...` | Take input from files | | `pipeline1 \| uplot -O \| pipeline2` | Outputs data from stdin to stdout | ### Subcommands The following sub-commands are available. | command | short | how it works | | --------- | ----- | -------------------------------------------------------- | | barplot | bar | draw a horizontal barplot | | histogram | hist | draw a horizontal histogram | | lineplot | line | draw a line chart | | lineplots | lines | draw a line chart with multiple series | | scatter | s | draw a scatter plot | | density | d | draw a density plot | | boxplot | box | draw a horizontal boxplot | | | | | | count | c | draw a barplot based on the number of occurrences (slow) | | | | | | colors | color | show the list of available colors | ### Output the plot * `-o` * By default, the plot is output to **standard error output**. * If you want to output to standard output, Use hyphen ` -o -` or no argument `uplot s -o | `. ### Output the input data * `-O` * By default, the input data is not shown anywhere. * If you want to pass the input data directly to the standard output, Use hyphen `-O -` or no argument `uplot s -O |`. * This is useful when passing data to a subsequent pipeline. ### Header * `-H` * If input data contains a header line, you need to specify the `-H` option. ### Delimiter * `-d` * You do not need to use `-d` option for tab-delimited text since the default value is tab. * To specify a blank space, you can use `uplot bar -d ' ' data.txt`. ### Real-time data * `-p` `--progress` * Experimental progressive mode is currently under development. * `ruby -e 'loop{puts rand(100)}' | uplot line --progress` ### Show detailed options for subcommands * `--help` * The `--help` option will show more detailed options for each subcommand. * `uplot hist --help` ### Set columns as x-axis or y-axis * YouPlot treats the first column as the X axis and the second column as the Y axis. When working with multiple series, the first column is the X axis, the second column is series Y1, the third column is series Y2, and so on. * If you pass only one column of data for `line` and `bar`, YouPlot will automatically use a sequential number starting from 1 as the X-axis. * `--fmt` * `--fmt xyy` `--fmt xyxy` `--fmt yx` options give you a few more choices. See `youplot --help` for more details. * The fmt option may be renamed in the future. * The `-x` and `-y` options might be used to specify columns in the future. * Use `awk '{print $2, $1}'` to swap columns. Use `paste` to concatenate series. ### Categorical data * With GNU datamash, you can manage to handle categorized data. * `cat test/fixtures/iris.csv | sed '/^$/d' | datamash --header-in --output-delimiter=: -t, -g5 collapse 3,4 | cut -f2-3 -d: | sed 's/:/\n/g' | uplot s -d, -T --fmt xyxy` * This is not so easy... ### Time series * Not yet supported. ### YouPlot Configuration (youplotrc) You can specify default options in a configuration file in YAML format. For more information, enter the following command. ``` uplot --config ``` ## Tools that are useful to use with YouPlot * [csvtk](https://github.com/shenwei356/csvtk) * [GNU datamash](https://www.gnu.org/software/datamash/) * [awk](https://www.gnu.org/software/gawk/) * [xsv](https://github.com/BurntSushi/xsv) ## Contributing YouPlot is a library under development, so even small improvements like typofix are welcome! Please feel free to send us your pull requests. * [Report bugs](https://github.com/red-data-tools/YouPlot/issues) * Fix bugs and [submit pull requests](https://github.com/red-data-tools/YouPlot/pulls) * Write, clarify, or fix documentation * English corrections by native speakers are welcome. * Suggest or add new features * Make a donation ### Development Fork the main repository by clicking the Fork button. ```sh git clone https://github.com/your_name/YouPlot bundle install bundle exec rake test bundle exec rake install bundle exec exe/uplot ``` Do you need commit rights to my repository? Do you want to get admin rights and take over the project? If so, please feel free to contact us. ### Acknowledgements * [sampo grafiikka](https://lepo.sampo-grafiikka.com/) - Project logo creation * [yutaas](https://github.com/yutaas) - English proofreading ## License [MIT License](https://opensource.org/licenses/MIT). red-data-tools-YouPlot-08da630/Rakefile000066400000000000000000000003421520446126500177420ustar00rootroot00000000000000# frozen_string_literal: true require 'bundler/gem_tasks' require 'rake/testtask' Rake::TestTask.new(:test) do |t| t.libs << 'test' t.libs << 'lib' t.test_files = FileList['test/**/*_test.rb'] end task default: :test red-data-tools-YouPlot-08da630/Steepfile000066400000000000000000000002611520446126500201400ustar00rootroot00000000000000D = Steep::Diagnostic target :lib do signature 'sig' check 'lib' # Directory name to check configure_code_diagnostics(D::Ruby.silent) # `silent` diagnostics setting end red-data-tools-YouPlot-08da630/exe/000077500000000000000000000000001520446126500170575ustar00rootroot00000000000000red-data-tools-YouPlot-08da630/exe/uplot000077500000000000000000000001551520446126500201510ustar00rootroot00000000000000#!/usr/bin/env ruby # frozen_string_literal: true require 'youplot' YouPlot::Command.new.run_as_executable red-data-tools-YouPlot-08da630/exe/youplot000077500000000000000000000001551520446126500205210ustar00rootroot00000000000000#!/usr/bin/env ruby # frozen_string_literal: true require 'youplot' YouPlot::Command.new.run_as_executable red-data-tools-YouPlot-08da630/lib/000077500000000000000000000000001520446126500170445ustar00rootroot00000000000000red-data-tools-YouPlot-08da630/lib/youplot.rb000066400000000000000000000012511520446126500211030ustar00rootroot00000000000000# frozen_string_literal: true require_relative 'youplot/version' require_relative 'youplot/dsv' require_relative 'youplot/parameters' require_relative 'youplot/command' module YouPlot # @run_as_executable = true / false # YouPlot behaves slightly differently when run as a command line tool # and when run as a script (e.g. for testing). In the event of an error, # when run as a command line tool, YouPlot will display a short error message # and exit abnormally. When run as a script, it will just raise an error. @run_as_executable = false class << self attr_accessor :run_as_executable def run_as_executable? @run_as_executable end end end red-data-tools-YouPlot-08da630/lib/youplot/000077500000000000000000000000001520446126500205575ustar00rootroot00000000000000red-data-tools-YouPlot-08da630/lib/youplot/aggregation.rb000066400000000000000000000100231520446126500233670ustar00rootroot00000000000000# frozen_string_literal: true module YouPlot module Aggregation module_function def count_values(arr, tally: true, reverse: false) # tally was added in Ruby 2.7 result = \ if tally && Enumerable.method_defined?(:tally) arr.tally else # value_counts Enumerable::Statistics arr.value_counts(dropna: false) end sort_cache = {} # sorting result = result.sort do |a, b| # compare values r = b[1] <=> a[1] # If the values are the same, compare by name r = natural_compare(a[0], b[0], sort_cache) if r.zero? r end # --reverse option result.reverse! if reverse # prepare for barplot result.transpose end # Natural order comparison for tie-breaking when counts are equal. # Fast paths handle text-only and pure numeric labels. # Mixed labels still use chunked comparison (e.g. "chr1" vs "chr10"). def natural_compare(a, b, cache = nil) aa = natural_sort_key(a, cache) bb = natural_sort_key(b, cache) # Fast path: both labels are text-only, so plain string comparison is enough. return aa[:string] <=> bb[:string] if aa[:type] == :text && bb[:type] == :text # Fast path: both labels are pure numbers, so compare numerically first. if aa[:type] == :numeric && bb[:type] == :numeric r = aa[:numeric] <=> bb[:numeric] return r unless r.zero? # Tiebreaker for equivalent numeric values (e.g. "1" and "01") return aa[:string] <=> bb[:string] end # Fallback path: at least one label mixes text and digits. ta = ensure_natural_tokens(aa) tb = ensure_natural_tokens(bb) max = [ta.size, tb.size].max 0.upto(max - 1) do |i| xa = ta[i] xb = tb[i] return -1 if xa.nil? return 1 if xb.nil? r = if xa[0] == :num && xb[0] == :num compare_integer_strings(xa[1], xb[1]) else xa[1] <=> xb[1] end return r unless r.zero? end aa[:string] <=> bb[:string] end # Classifies a value for natural sorting and caches the result per label. def natural_sort_key(value, cache = nil) str = value.to_s return cache[str] if cache && cache.key?(str) key = if str.match?(/\d/) numeric = parse_numeric(str) if numeric # Pure numeric labels get a dedicated fast path. { type: :numeric, string: str, numeric: numeric } else # Mixed labels fall back to chunked natural comparison. { type: :mixed, string: str, tokens: nil } end else # Text-only labels get a dedicated fast path. { type: :text, string: str, tokens: nil } end cache ? cache[str] = key : key end # Memoizes token pairs for fallback chunked comparison. def ensure_natural_tokens(key) key[:tokens] ||= natural_tokens(key[:string]) end # Parses a string as a numeric value if it matches pure number format. # Returns Float or nil. def parse_numeric(str) return nil unless str.match?(/\A[+-]?(?:\d+(?:\.\d+)?|\.\d+)\z/) str.to_f end # Splits a string into [type, token] pairs for natural comparison. # Type is :num for digit-only chunks, :text for anything else. # E.g. "chr10" => [[:text, "chr"], [:num, "10"]] def natural_tokens(str) str.scan(/\d+|\D+/).map do |tok| kind = tok.match?(/\A\d+\z/) ? :num : :text [kind, tok] end end # Compares two numeric strings, handling leading zeros. # Order: by length (sans leading zeros), then numeric value, then original. def compare_integer_strings(a, b) aa = a.sub(/\A0+/, '') bb = b.sub(/\A0+/, '') aa = '0' if aa.empty? bb = '0' if bb.empty? r = aa.length <=> bb.length return r unless r.zero? r = aa <=> bb return r unless r.zero? a <=> b end end end red-data-tools-YouPlot-08da630/lib/youplot/backends/000077500000000000000000000000001520446126500223315ustar00rootroot00000000000000red-data-tools-YouPlot-08da630/lib/youplot/backends/unicode_plot.rb000066400000000000000000000176061520446126500253540ustar00rootroot00000000000000# frozen_string_literal: true # UnicodePlot - Plot your data by Unicode characters # https://github.com/red-data-tools/unicode_plot.rb require_relative '../aggregation' require 'unicode_plot' # If the line color is specified as a number, the program will display an error # message to the user and exit. Remove this patch when UnicodePlot is improved. module UnicodePlot class << self alias lineplot_original lineplot def lineplot(*args, **kw) if kw[:color].is_a? Numeric warn <<~EOS YouPlot: Line colors cannot be specified by numerical values. For more information, please see the following issue. https://github.com/red-data-tools/unicode_plot.rb/issues/34 EOS YouPlot.run_as_executable ? exit(1) : raise(Error) end lineplot_original(*args, **kw) end end end module YouPlot # plotting functions. module Backends module UnicodePlot class Error < StandardError; end module_function def barplot(data, params, fmt = nil, count: false, reverse: false) headers = data.headers series = data.series # `uplot count` if count series = YouPlot::Aggregation.count_values(series[0], reverse: reverse) params.title = headers[0] if headers end if series.size == 1 # If there is only one series.use the line number for label. params.title ||= headers[0] if headers labels = Array.new(series[0].size) { |i| (i + 1).to_s } raw_values = series[0] values = series[0].map(&:to_f) else # If there are 2 or more series... if fmt == 'yx' # assume that the first 2 series are the y and x series respectively. x_col = 1 y_col = 0 else # assume that the first 2 series are the x and y series respectively. x_col = 0 y_col = 1 end params.title ||= headers[y_col] if headers labels = series[x_col] raw_values = series[y_col] values = if count series[y_col].map(&:to_i) else series[y_col].map(&:to_f) end end values = values.map(&:to_i) if count || integer_display_values?(values, raw_values) ::UnicodePlot.barplot(labels, values, **params.to_hc) end # True only for integer literals: "3" => true, "3.0" => false. def integer_display_values?(values, raw_values) values.all? { |v| v.finite? && v == v.to_i } && raw_values.all? { |v| integer_literal?(v) } end def integer_literal?(value) # Matches "3" and "-12", but not "3.0". value.to_s.match?(/\A[+-]?\d+\z/) end def histogram(data, params) headers = data.headers series = data.series params.title ||= data.headers[0] if headers values = series[0].map(&:to_f) ::UnicodePlot.histogram(values, **params.to_hc) end def line(data, params, fmt = nil) headers = data.headers series = data.series if series.size == 1 # If there is only one series, it is assumed to be sequential data. params.ylabel ||= headers[0] if headers y = series[0].map(&:to_f) ::UnicodePlot.lineplot(y, **params.to_hc) else # If there are 2 or more series... if fmt == 'yx' # assume that the first 2 series are the y and x series respectively. x_col = 1 y_col = 0 else # assume that the first 2 series are the x and y series respectively. x_col = 0 y_col = 1 end if headers params.xlabel ||= headers[x_col] params.ylabel ||= headers[y_col] end x = series[x_col].map(&:to_f) y = series[y_col].map(&:to_f) ::UnicodePlot.lineplot(x, y, **params.to_hc) end end def get_method2(method1) "#{method1}!".to_sym end def plot_xyy(data, method1, params) headers = data.headers series = data.series method2 = get_method2(method1) series.map! { |s| s.map(&:to_f) } if headers params.name ||= headers[1] params.xlabel ||= headers[0] end params.xlim ||= series[0].flatten.minmax # why need? params.ylim ||= series[1..-1].flatten.minmax # why need? plot = ::UnicodePlot.public_send(method1, series[0], series[1], **params.to_hc) 2.upto(series.size - 1) do |i| ::UnicodePlot.public_send(method2, plot, series[0], series[i], name: headers&.[](i)) end plot end def plot_xyxy(data, method1, params) headers = data.headers series2 = data.series .map { |s| s.map(&:to_f) } .each_slice(2).to_a method2 = get_method2(method1) params.name ||= headers[0] if headers params.xlim ||= series2.map(&:first).flatten.minmax # why need? params.ylim ||= series2.map(&:last).flatten.minmax # why need? x1, y1 = series2.shift plot = ::UnicodePlot.public_send(method1, x1, y1, **params.to_hc) series2.each_with_index do |(xi, yi), i| ::UnicodePlot.public_send(method2, plot, xi, yi, name: headers&.[]((i + 1) * 2)) end plot end def plot_fmt(data, fmt, method1, params) case fmt when 'xyy' plot_xyy(data, method1, params) when 'xyxy' plot_xyxy(data, method1, params) when 'yx' raise "Incorrect format: #{fmt}" else raise "Unknown format: #{fmt}" end end def lines(data, params, fmt = 'xyy') check_series_size(data, fmt) plot_fmt(data, fmt, :lineplot, params) end def scatter(data, params, fmt = 'xyy') check_series_size(data, fmt) plot_fmt(data, fmt, :scatterplot, params) end def density(data, params, fmt = 'xyy') check_series_size(data, fmt) plot_fmt(data, fmt, :densityplot, params) end def boxplot(data, params) headers = data.headers series = data.series headers ||= (1..series.size).map(&:to_s) series.map! { |s| s.map(&:to_f) } ::UnicodePlot.boxplot(headers, series, **params.to_hc) end def colors(color_names = false) # FIXME s = String.new ::UnicodePlot::StyledPrinter::TEXT_COLORS.each do |k, v| s << v s << k.to_s unless color_names s << "\t" s << ' â—' end s << "\033[0m" s << "\t" end s << "\n" def s.render(obj) obj.print(self) end s end def check_series_size(data, fmt) series = data.series raise_if_single_series(data, series) if series.size == 1 raise_if_odd_series_for_xyxy(data, fmt, series) end def raise_if_single_series(data, series) warn <<~EOS YouPlot: There is only one series of input data. Please check the delimiter. Headers: \e[35m#{data.headers.inspect}\e[0m The first item is: \e[35m\"#{series[0][0]}\"\e[0m The last item is : \e[35m\"#{series[0][-1]}\"\e[0m EOS raise_plot_error end def raise_if_odd_series_for_xyxy(data, fmt, series) return unless fmt == 'xyxy' return if series.size.even? warn <<~EOS YouPlot: In the xyxy format, the number of series must be even. Number of series: \e[35m#{series.size}\e[0m Headers: \e[35m#{data.headers.inspect}\e[0m EOS raise_plot_error end def raise_plot_error # NOTE: Error messages cannot be colored. YouPlot.run_as_executable ? exit(1) : raise(Error) end end end end red-data-tools-YouPlot-08da630/lib/youplot/command.rb000066400000000000000000000225241520446126500225270ustar00rootroot00000000000000# frozen_string_literal: true require 'tempfile' require 'stringio' require_relative 'dsv' require_relative 'parser' require_relative 'backends/unicode_plot' module YouPlot Data = Struct.new(:headers, :series) class Command attr_accessor :command, :params, :options attr_reader :data, :parser def initialize(argv = ARGV) @argv = argv @parser = Parser.new @command = nil @params = nil @options = nil @backend = YouPlot::Backends::UnicodePlot end def run_as_executable YouPlot.run_as_executable = true run end def run parser.parse_options(@argv) @command ||= parser.command @options ||= parser.options @params ||= parser.params # color command if %i[colors color colours colour].include? @command plot = create_plot output_plot(plot) return end # progressive mode if options[:progressive] run_progressive # normal mode else # Sometimes the input file does not end with a newline code. begin begin input = Kernel.gets(nil) rescue Errno::ENOENT => e warn e.message next end main(input) end until input end end private def run_progressive out = progressive_output stop = false last_rendered_lines = 0 Signal.trap(:INT) { stop = true } # make cursor invisible out.print "\e[?25l" # mainloop begin while (input = Kernel.gets) n = main_progressive(input) # Track the latest plot height so cleanup can move below the plot. last_rendered_lines = n if n && n > 0 break if stop out.print "\e[#{n}F" if n && n > 0 end ensure sanitize_progressive_output(out, last_rendered_lines) end end def progressive_output out = options[:output] raise 'In progressive mode, output to a file is not possible.' if out.is_a?(String) return out if out.respond_to?(:print) && out.respond_to?(:flush) raise 'In progressive mode, output to a file is not possible.' end def sanitize_progressive_output(out = progressive_output, last_rendered_lines = 0) # Move below the last rendered plot (CSI n E). out.print "\e[#{last_rendered_lines}E" if last_rendered_lines > 0 # Clear from cursor to end of screen (CSI 0 J). out.print "\e[0J" # Show cursor again (CSI ?25 h). out.print "\e[?25h" end def main(input) # Outputs input data to a file or stdout. output_data(input) @data = parse_dsv(input) # Debug mode, show parsed results pp @data if options[:debug] # When run as a program instead of a library if YouPlot.run_as_executable? begin plot = create_plot rescue ArgumentError => e # Show only one line of error. warn e.backtrace[0] # Show error message in purple warn "\e[35m#{e}\e[0m" # Explicitly terminated with exit code: 1 exit 1 end # When running YouPlot as a library (e.g. for testing) else plot = create_plot end output_plot(plot) end def main_progressive(input) output_data(input) row = parse_progressive_row(input) return 0 if row.nil? @data = progressive_update_data(row) return 0 if @data.nil? plot = create_plot output_plot_progressive(plot) end def parse_progressive_row(input) line = normalize_input_encoding!(input) begin row = CSV.parse_line(line, col_sep: options[:delimiter]) rescue CSV::MalformedCSVError => e warn 'Failed to parse the text. ' warn 'Please try to set the correct character encoding with --encoding option.' warn e.backtrace.grep(/youplot/).first exit 1 rescue ArgumentError => e warn 'Failed to parse the text. ' warn e.backtrace.grep(/youplot/).first exit 1 end return nil if row.nil? || row.empty? || row.all?(&:nil?) row end def progressive_update_data(row) init_progressive_state return nil if consume_progressive_header?(row) append_progressive_row(row) progressive_data end def init_progressive_state return if @progressive_initialized @progressive_initialized = true @progressive_headers = options[:headers] ? [] : nil @progressive_series = [] @progressive_header_consumed = false @progressive_row_count = 0 end def consume_progressive_header?(row) return false unless options[:headers] return false if options[:transpose] return false if @progressive_header_consumed @progressive_headers = row @progressive_header_consumed = true true end def append_progressive_row(row) if options[:headers] && options[:transpose] @progressive_headers << row[0] @progressive_series << row[1..-1] elsif options[:transpose] @progressive_series << row else append_progressive_columns(row) end end def progressive_data DSV.build_data(@progressive_headers, @progressive_series) end def append_progressive_columns(row) if row.size > @progressive_series.size (@progressive_series.size...row.size).each do |i| @progressive_series[i] = Array.new(@progressive_row_count, nil) end end 0.upto(@progressive_series.size - 1) do |i| @progressive_series[i] << row[i] end @progressive_row_count += 1 end def parse_dsv(input) # If encoding is specified, convert to UTF-8 normalize_input_encoding!(input) begin data = DSV.parse(input, options[:delimiter], options[:headers], options[:transpose]) rescue CSV::MalformedCSVError => e warn 'Failed to parse the text. ' warn 'Please try to set the correct character encoding with --encoding option.' warn e.backtrace.grep(/youplot/).first exit 1 rescue ArgumentError => e warn 'Failed to parse the text. ' warn e.backtrace.grep(/youplot/).first exit 1 end data end def normalize_input_encoding!(input) return input unless options[:encoding] input.force_encoding(options[:encoding]) .encode!('utf-8') end def create_plot case command when :bar, :barplot @backend.barplot(data, params, options[:fmt]) when :count, :c @backend.barplot(data, params, count: true, reverse: options[:reverse]) when :hist, :histogram @backend.histogram(data, params) when :line, :lineplot, :l @backend.line(data, params, options[:fmt]) when :lines, :lineplots, :ls @backend.lines(data, params, options[:fmt]) when :scatter, :s @backend.scatter(data, params, options[:fmt]) when :density, :d @backend.density(data, params, options[:fmt]) when :box, :boxplot @backend.boxplot(data, params) when :colors, :color, :colours, :colour @backend.colors(options[:color_names]) else raise "unrecognized plot_type: #{command}" end end def output_data(input) # Pass the input to subsequent pipelines out = options[:pass] # Handle Tempfile first to keep tests and behavior consistent. # Ruby 2.7 Tempfile is Delegator-based and does not match IO/File checks. # Then handle path strings and IO-like objects. case out when Tempfile # Keep file descriptor state consistent with the Tempfile object. out.truncate(0) # clear existing content out.rewind # move pointer to the beginning out.print(input) # write new content out.flush # flush buffered writes before immediate read out.rewind # move pointer back to the beginning for out.read when String File.open(out, 'w') do |f| f.print(input) end else out.print(input) if out.respond_to?(:print) end end def output_plot(plot) out = options[:output] # Handle Tempfile first to keep tests and behavior consistent. # Ruby 2.7 Tempfile is Delegator-based and does not match IO/File checks. # Then handle path strings and IO-like objects. case out when Tempfile # Keep file descriptor state consistent with the Tempfile object. out.truncate(0) # clear existing content out.rewind # move pointer to the beginning plot.render(out) # write new content out.flush # flush buffered writes before immediate read out.rewind # move pointer back to the beginning for out.read when String File.open(out, 'w') do |f| plot.render(f) end else plot.render(out) if out.respond_to?(:write) end end def output_plot_progressive(plot) target = progressive_output # RefactorMe out = StringIO.new(String.new) def out.tty? true end plot.render(out) lines = out.string.lines lines.each do |line| target.print line.chomp target.print "\e[0K" target.puts end target.print "\e[0J" target.flush lines.size end end end red-data-tools-YouPlot-08da630/lib/youplot/dsv.rb000066400000000000000000000046521520446126500217070ustar00rootroot00000000000000# frozen_string_literal: true require 'csv' module YouPlot # Module to handle DSV (Delimiter-separated values) format. # Extract header and series. module DSV module_function def parse(input, delimiter, headers, transpose) # Parse as CSV arr = CSV.parse(input, col_sep: delimiter) # Remove blank lines arr.delete_if do |i| i == [] or i.all?(&:nil?) end # get header headers = get_headers(arr, headers, transpose) # get series series = get_series(arr, headers, transpose) build_data(headers, series) end # Transpose different sized ruby arrays # https://stackoverflow.com/q/26016632 def transpose2(arr) Array.new(arr.map(&:length).max) { |i| arr.map { |e| e[i] } } end def build_data(headers, series) # Return if No header return Data.new(headers, series) if headers.nil? h_size, s_size = validate_headers(headers, series) Data.new(headers, series) if h_size == s_size end def validate_headers(headers, series) # Warn if header contains nil warn "\e[35mHeaders contains nil in it.\e[0m" if headers.include?(nil) # Warn if header contains '' warn "\e[35mHeaders contains \"\" in it.\e[0m" if headers.include? '' # Make sure the number of elements in the header matches the number of series. h_size = headers.size s_size = series.size if h_size > s_size warn "\e[35mThe number of headers is greater than the number of series.\e[0m" exit 1 if YouPlot.run_as_executable? elsif h_size < s_size warn "\e[35mThe number of headers is less than the number of series.\e[0m" exit 1 if YouPlot.run_as_executable? end [h_size, s_size] end def get_headers(arr, headers, transpose) # header(-) return nil unless headers # header(+) trenspose(+) return arr.map(&:first) if transpose # header(+) transpose(-) arr[0] end def get_series(arr, headers, transpose) # header(-) unless headers return arr if transpose return transpose2(arr) end # header(+) but no element in the series. # TODO: should raise error? return Array.new(arr[0].size, []) if arr.size == 1 # header(+) transpose(+) return arr.map { |row| row[1..-1] } if transpose # header(+) transpose(-) transpose2(arr[1..-1]) end end end red-data-tools-YouPlot-08da630/lib/youplot/options.rb000066400000000000000000000015231520446126500226000ustar00rootroot00000000000000# frozen_string_literal: true module YouPlot # Command line options that are not Plot parameters Options = Struct.new( :delimiter, :transpose, :headers, :pass, :output, :fmt, :progressive, :encoding, :reverse, # count :color_names, # color :debug ) # Default values for options. # These are applied in Parser#resolve_options. # Based on the following priority: # 1. CLI options (highest priority) # 2. Config file options # 3. Default values (lowest priority) specified here. Options::DEFAULTS = { delimiter: "\t", transpose: false, headers: nil, pass: false, output: nil, # resolved to $stderr at parse time (late binding) fmt: 'xyy', progressive: false, encoding: nil, reverse: false, color_names: false, debug: false }.freeze end red-data-tools-YouPlot-08da630/lib/youplot/parameters.rb000066400000000000000000000010321520446126500232430ustar00rootroot00000000000000# frozen_string_literal: true module YouPlot # UnicodePlot parameters. # Why Struct, not Hash? # * The keys are static in Struct. # * Struct does not conflict with keyword arguments. Hash dose. Parameters = Struct.new( # Sort me! :title, :width, :height, :border, :margin, :padding, :color, :xlabel, :ylabel, :labels, :symbol, :xscale, :nbins, :closed, :canvas, :xlim, :ylim, :grid, :name ) do def to_hc to_h.compact end end end red-data-tools-YouPlot-08da630/lib/youplot/parser.rb000066400000000000000000000341761520446126500224130ustar00rootroot00000000000000# frozen_string_literal: true require 'optparse' require_relative 'options' module YouPlot # Class for parsing command line options class Parser class Error < StandardError; end attr_reader :command, :options, :params, :main_parser, :sub_parser, :config_file, :config def initialize @command = nil @options = Options.new @params = Parameters.new end def apply_config_file return if !config_file && find_config_file.nil? read_config_file end def config_file_candidate_paths # keep the order of the paths paths = [] paths << ENV['MYYOUPLOTRC'] if ENV['MYYOUPLOTRC'] paths << '.youplot.yml' paths << '.youplotrc' if ENV['HOME'] paths << File.join(ENV['HOME'], '.youplotrc') paths << File.join(ENV['HOME'], '.youplot.yml') paths << File.join(ENV['HOME'], '.config', 'youplot', 'youplotrc') paths << File.join(ENV['HOME'], '.config', 'youplot', 'youplot.yml') end paths end def find_config_file config_file_candidate_paths.each do |file| path = File.expand_path(file) next unless File.exist?(path) @config_file = path ENV['MYYOUPLOTRC'] = path return @config_file end nil end def read_config_file require 'yaml' @config = YAML.load_file(config_file) end # Resolve options by applying the following priority: # 1. CLI options -- cli_val = @options[k] # 2. Config file -- cfg_val = @config[k.to_s] # 3. DEFAULTS -- def_val from Options::DEFAULTS def resolve_options # Validate config keys up front. if @config known = (@options.members + @params.members).map(&:to_s) @config.each_key do |k| raise Error, "Unknown option/param in config file: #{k}" unless known.include?(k) end end Options::DEFAULTS.each do |k, def_val| cfg_val = @config && @config[k.to_s] cli_val = @options[k] @options[k] = if !cli_val.nil? # can be false cli_val elsif !cfg_val.nil? # can be false cfg_val else def_val end end # $stderr is evaluated here, not in DEFAULTS. # DEFAULTS is a constant, so values in it are fixed at class load time. # Tests redirect $stderr = tempfile after load, so placing $stderr in DEFAULTS # would capture the original stderr and ignore the test redirect. @options[:output] = $stderr if @options[:output].nil? @options[:output] = $stdout if @options[:output] == '-' @options[:pass] = $stdout if @options[:pass] == '-' @params.members.each do |k| cfg_val = @config && @config[k.to_s] cli_val = @params[k] # no def_val for params @params[k] = cfg_val if cli_val.nil? && !cfg_val.nil? end end def create_base_parser OptionParser.new do |parser| parser.program_name = 'YouPlot' parser.version = YouPlot::VERSION parser.summary_width = 23 parser.on_tail('') # Add a blank line at the end parser.separator('') parser.on('Common options:') parser.on('-O', '--pass [FILE]', 'file to output input data to [stdout]', 'for inserting YouPlot in the middle of Unix pipes') do |v| options[:pass] = v.nil? || v == '-' ? $stdout : v end parser.on('-o', '--output [FILE]', 'file to output plots to [stdout]', 'If no option is specified, plot will print to stderr') do |v| options[:output] = v.nil? || v == '-' ? $stdout : v end parser.on('-d', '--delimiter DELIM', String, 'use DELIM instead of [TAB] for field delimiter') do |v| options[:delimiter] = v end parser.on('-H', '--headers', TrueClass, 'specify that the input has header row') do |v| options[:headers] = v end parser.on('-T', '--transpose', TrueClass, 'transpose the axes of the input data') do |v| options[:transpose] = v end parser.on('-t', '--title STR', String, 'print string on the top of plot') do |v| params.title = v end parser.on('--xlabel STR', String, 'print string on the bottom of the plot') do |v| params.xlabel = v end parser.on('--ylabel STR', String, 'print string on the far left of the plot') do |v| params.ylabel = v end parser.on('-w', '--width INT', Numeric, 'number of characters per row') do |v| params.width = v end parser.on('-h', '--height INT', Numeric, 'number of rows') do |v| params.height = v end border_options = UnicodePlot::BORDER_MAP.keys.join(', ') parser.on('-b', '--border STR', String, 'specify the style of the bounding box', "(#{border_options})") do |v| params.border = v.to_sym end parser.on('-m', '--margin INT', Numeric, 'number of spaces to the left of the plot') do |v| params.margin = v end parser.on('--padding INT', Numeric, 'space of the left and right of the plot') do |v| params.padding = v end parser.on('-c', '--color VAL', String, 'color of the drawing') do |v| params.color = v =~ /\A[0-9]+\z/ ? v.to_i : v.to_sym end parser.on('--[no-]labels', TrueClass, 'hide the labels') do |v| params.labels = v end parser.on('-p', '--progress', TrueClass, 'progressive mode [experimental]') do |v| options[:progressive] = v end parser.on('-C', '--color-output', TrueClass, 'colorize even if writing to a pipe') do |_v| UnicodePlot::IOContext.define_method(:color?) { true } # FIXME end parser.on('-M', '--monochrome', TrueClass, 'no colouring even if writing to a tty') do |_v| UnicodePlot::IOContext.define_method(:color?) { false } # FIXME end parser.on('--encoding STR', String, 'specify the input encoding') do |v| options[:encoding] = v end # Optparse adds the help option, but it doesn't show up in usage. # This is why you need the code below. parser.on('--help', 'print sub-command help menu') do puts parser.help exit if YouPlot.run_as_executable? end parser.on('--config FILE', 'specify a config file') do |v| @config_file = v end parser.on('--debug', TrueClass, 'print preprocessed data') do |v| options[:debug] = v end # yield opt if block_given? end end def create_main_parser @main_parser = create_base_parser main_parser.banner = \ <<~MSG Program: YouPlot (Tools for plotting on the terminal) Version: #{YouPlot::VERSION} (using UnicodePlot #{UnicodePlot::VERSION}) Source: https://github.com/red-data-tools/YouPlot Usage: uplot [options] Commands: barplot bar draw a horizontal barplot histogram hist draw a horizontal histogram lineplot line draw a line chart lineplots lines draw a line chart with multiple series scatter s draw a scatter plot density d draw a density plot boxplot box draw a horizontal boxplot count c draw a barplot based on the number of occurrences (slow) colors color show the list of available colors General options: --config print config file info --help print command specific help menu --version print the version of YouPlot MSG # Help for the main parser is simple. # Simply show the banner above. main_parser.on('--help', 'print sub-command help menu') do show_main_help end main_parser.on('--config', 'show config file info') do show_config_info end end def show_main_help(out = $stdout) out.puts main_parser.banner out.puts exit if YouPlot.run_as_executable? end def show_config_info ensure_config_loaded if @config_file puts "config file : #{@config_file}" puts config.inspect else puts <<~EOS Configuration file not found. It should be a YAML file, like this example: width : 40 height : 20 By default, YouPlot will look for the configuration file in these locations: #{config_file_candidate_paths.map { |s| ' ' + s }.join("\n")} If you have the file elsewhere, you can specify its location with the `MYYOUPLOTRC` environment variable. EOS end exit if YouPlot.run_as_executable? end def ensure_config_loaded apply_config_file unless config rescue StandardError => e raise unless YouPlot.run_as_executable? warn "YouPlot: #{e.message}" exit 1 end def sub_parser_add_symbol sub_parser.on_head('--symbol STR', String, 'character to be used to plot the bars') do |v| params.symbol = v end end def sub_parser_add_xscale xscale_options = UnicodePlot::ValueTransformer::PREDEFINED_TRANSFORM_FUNCTIONS.keys.join(', ') sub_parser.on_head('--xscale STR', String, "axis scaling (#{xscale_options})") do |v| params.xscale = v.to_sym end end def sub_parser_add_canvas canvas_types = UnicodePlot::Canvas::CANVAS_CLASS_MAP.keys.join(', ') sub_parser.on_head('--canvas STR', String, 'type of canvas', "(#{canvas_types})") do |v| params.canvas = v.to_sym end end def sub_parser_add_xlim sub_parser.on_head('--xlim FLOAT,FLOAT', Array, 'plotting range for the x coordinate') do |v| params.xlim = v.map(&:to_f) end end def sub_parser_add_ylim sub_parser.on_head('--ylim FLOAT,FLOAT', Array, 'plotting range for the y coordinate') do |v| params.ylim = v.map(&:to_f) end end def sub_parser_add_grid sub_parser.on_head('--[no-]grid', TrueClass, 'draws grid-lines at the origin') do |v| params.grid = v end end def sub_parser_add_fmt_xyxy sub_parser.on_head('--fmt STR', String, 'xyxy : header is like x1, y1, x2, y2, x3, y3...', 'xyy : header is like x, y1, y2, y2, y3...') do |v| options[:fmt] = v end end def sub_parser_add_fmt_yx sub_parser.on_head('--fmt STR', String, 'xy : header is like x, y...', 'yx : header is like y, x...') do |v| options[:fmt] = v end end def create_sub_parser @sub_parser = create_base_parser sub_parser.banner = \ <<~MSG Usage: YouPlot #{command} [options] Options for #{command}: MSG case command # If you type only `uplot` in the terminal. # Output help to standard error output. when nil show_main_help($stderr) # Output help to standard output. when :help show_main_help when :barplot, :bar sub_parser_add_symbol sub_parser_add_fmt_yx sub_parser_add_xscale when :count, :c sub_parser.on_head('-r', '--reverse', TrueClass, 'reverse the result of comparisons') do |v| options.reverse = v end sub_parser_add_symbol sub_parser_add_xscale when :histogram, :hist sub_parser_add_symbol sub_parser.on_head('--closed STR', String, 'side of the intervals to be closed [left]') do |v| params.closed = v end sub_parser.on_head('-n', '--nbins INT', Numeric, 'approximate number of bins') do |v| params.nbins = v end when :lineplot, :line, :l sub_parser_add_canvas sub_parser_add_grid sub_parser_add_fmt_yx sub_parser_add_ylim sub_parser_add_xlim when :lineplots, :lines, :ls sub_parser_add_canvas sub_parser_add_grid sub_parser_add_fmt_xyxy sub_parser_add_ylim sub_parser_add_xlim when :scatter, :s sub_parser_add_canvas sub_parser_add_grid sub_parser_add_fmt_xyxy sub_parser_add_ylim sub_parser_add_xlim when :density, :d sub_parser_add_canvas sub_parser_add_grid sub_parser_add_fmt_xyxy sub_parser_add_ylim sub_parser_add_xlim when :boxplot, :box sub_parser_add_xlim when :colors, :color, :colours, :colour sub_parser.on_head('-n', '--names', TrueClass, 'show color names only') do |v| options[:color_names] = v end # Currently it simply displays the configuration file, # but in the future this may be changed to open a text editor like Vim # to edit the configuration file. when :config show_config_info else error_message = "YouPlot: unrecognized command '#{command}'" raise Error, error_message unless YouPlot.run_as_executable? warn error_message exit 1 end end def parse_options(argv = ARGV) # keep original ARGV intact. argv = argv.equal?(ARGV) ? argv : argv.dup begin create_main_parser.order!(argv) rescue OptionParser::ParseError => e warn "YouPlot: #{e.message}" exit 1 if YouPlot.run_as_executable? end @command = argv.shift&.to_sym begin create_sub_parser&.parse!(argv) rescue OptionParser::ParseError => e warn "YouPlot: #{e.message}" exit 1 if YouPlot.run_as_executable? end # Read config after CLI parsing, then resolve: defaults < config < CLI. begin apply_config_file rescue StandardError => e warn "YouPlot: #{e.message}" exit 1 if YouPlot.run_as_executable? end resolve_options end end end red-data-tools-YouPlot-08da630/lib/youplot/version.rb000066400000000000000000000001061520446126500225660ustar00rootroot00000000000000# frozen_string_literal: true module YouPlot VERSION = '0.5.0' end red-data-tools-YouPlot-08da630/logo.svg000066400000000000000000000510531520446126500177630ustar00rootroot00000000000000 red-data-tools-YouPlot-08da630/sig/000077500000000000000000000000001520446126500170605ustar00rootroot00000000000000red-data-tools-YouPlot-08da630/sig/youplot/000077500000000000000000000000001520446126500205735ustar00rootroot00000000000000red-data-tools-YouPlot-08da630/sig/youplot/aggregation.rbs000066400000000000000000000002261520446126500235720ustar00rootroot00000000000000module YouPlot module Aggregation def self.count_values: (Enumerable[untyped], ?tally: bool, ?reverse: bool) -> Array[Array[untyped]] end end red-data-tools-YouPlot-08da630/test/000077500000000000000000000000001520446126500172555ustar00rootroot00000000000000red-data-tools-YouPlot-08da630/test/fixtures/000077500000000000000000000000001520446126500211265ustar00rootroot00000000000000red-data-tools-YouPlot-08da630/test/fixtures/IRIStsv.tsv000066400000000000000000000105621520446126500231730ustar00rootroot00000000000000sepal_length sepal_width petal_length petal_width species 5.1 3.5 1.4 0.2 Iris-setosa 4.9 3 1.4 0.2 Iris-setosa 4.7 3.2 1.3 0.2 Iris-setosa 4.6 3.1 1.5 0.2 Iris-setosa 5 3.6 1.4 0.2 Iris-setosa 5.4 3.9 1.7 0.4 Iris-setosa 4.6 3.4 1.4 0.3 Iris-setosa 5 3.4 1.5 0.2 Iris-setosa 4.4 2.9 1.4 0.2 Iris-setosa 4.9 3.1 1.5 0.1 Iris-setosa 5.4 3.7 1.5 0.2 Iris-setosa 4.8 3.4 1.6 0.2 Iris-setosa 4.8 3 1.4 0.1 Iris-setosa 4.3 3 1.1 0.1 Iris-setosa 5.8 4 1.2 0.2 Iris-setosa 5.7 4.4 1.5 0.4 Iris-setosa 5.4 3.9 1.3 0.4 Iris-setosa 5.1 3.5 1.4 0.3 Iris-setosa 5.7 3.8 1.7 0.3 Iris-setosa 5.1 3.8 1.5 0.3 Iris-setosa 5.4 3.4 1.7 0.2 Iris-setosa 5.1 3.7 1.5 0.4 Iris-setosa 4.6 3.6 1 0.2 Iris-setosa 5.1 3.3 1.7 0.5 Iris-setosa 4.8 3.4 1.9 0.2 Iris-setosa 5 3 1.6 0.2 Iris-setosa 5 3.4 1.6 0.4 Iris-setosa 5.2 3.5 1.5 0.2 Iris-setosa 5.2 3.4 1.4 0.2 Iris-setosa 4.7 3.2 1.6 0.2 Iris-setosa 4.8 3.1 1.6 0.2 Iris-setosa 5.4 3.4 1.5 0.4 Iris-setosa 5.2 4.1 1.5 0.1 Iris-setosa 5.5 4.2 1.4 0.2 Iris-setosa 4.9 3.1 1.5 0.1 Iris-setosa 5 3.2 1.2 0.2 Iris-setosa 5.5 3.5 1.3 0.2 Iris-setosa 4.9 3.1 1.5 0.1 Iris-setosa 4.4 3 1.3 0.2 Iris-setosa 5.1 3.4 1.5 0.2 Iris-setosa 5 3.5 1.3 0.3 Iris-setosa 4.5 2.3 1.3 0.3 Iris-setosa 4.4 3.2 1.3 0.2 Iris-setosa 5 3.5 1.6 0.6 Iris-setosa 5.1 3.8 1.9 0.4 Iris-setosa 4.8 3 1.4 0.3 Iris-setosa 5.1 3.8 1.6 0.2 Iris-setosa 4.6 3.2 1.4 0.2 Iris-setosa 5.3 3.7 1.5 0.2 Iris-setosa 5 3.3 1.4 0.2 Iris-setosa 7 3.2 4.7 1.4 Iris-versicolor 6.4 3.2 4.5 1.5 Iris-versicolor 6.9 3.1 4.9 1.5 Iris-versicolor 5.5 2.3 4 1.3 Iris-versicolor 6.5 2.8 4.6 1.5 Iris-versicolor 5.7 2.8 4.5 1.3 Iris-versicolor 6.3 3.3 4.7 1.6 Iris-versicolor 4.9 2.4 3.3 1 Iris-versicolor 6.6 2.9 4.6 1.3 Iris-versicolor 5.2 2.7 3.9 1.4 Iris-versicolor 5 2 3.5 1 Iris-versicolor 5.9 3 4.2 1.5 Iris-versicolor 6 2.2 4 1 Iris-versicolor 6.1 2.9 4.7 1.4 Iris-versicolor 5.6 2.9 3.6 1.3 Iris-versicolor 6.7 3.1 4.4 1.4 Iris-versicolor 5.6 3 4.5 1.5 Iris-versicolor 5.8 2.7 4.1 1 Iris-versicolor 6.2 2.2 4.5 1.5 Iris-versicolor 5.6 2.5 3.9 1.1 Iris-versicolor 5.9 3.2 4.8 1.8 Iris-versicolor 6.1 2.8 4 1.3 Iris-versicolor 6.3 2.5 4.9 1.5 Iris-versicolor 6.1 2.8 4.7 1.2 Iris-versicolor 6.4 2.9 4.3 1.3 Iris-versicolor 6.6 3 4.4 1.4 Iris-versicolor 6.8 2.8 4.8 1.4 Iris-versicolor 6.7 3 5 1.7 Iris-versicolor 6 2.9 4.5 1.5 Iris-versicolor 5.7 2.6 3.5 1 Iris-versicolor 5.5 2.4 3.8 1.1 Iris-versicolor 5.5 2.4 3.7 1 Iris-versicolor 5.8 2.7 3.9 1.2 Iris-versicolor 6 2.7 5.1 1.6 Iris-versicolor 5.4 3 4.5 1.5 Iris-versicolor 6 3.4 4.5 1.6 Iris-versicolor 6.7 3.1 4.7 1.5 Iris-versicolor 6.3 2.3 4.4 1.3 Iris-versicolor 5.6 3 4.1 1.3 Iris-versicolor 5.5 2.5 4 1.3 Iris-versicolor 5.5 2.6 4.4 1.2 Iris-versicolor 6.1 3 4.6 1.4 Iris-versicolor 5.8 2.6 4 1.2 Iris-versicolor 5 2.3 3.3 1 Iris-versicolor 5.6 2.7 4.2 1.3 Iris-versicolor 5.7 3 4.2 1.2 Iris-versicolor 5.7 2.9 4.2 1.3 Iris-versicolor 6.2 2.9 4.3 1.3 Iris-versicolor 5.1 2.5 3 1.1 Iris-versicolor 5.7 2.8 4.1 1.3 Iris-versicolor 6.3 3.3 6 2.5 Iris-virginica 5.8 2.7 5.1 1.9 Iris-virginica 7.1 3 5.9 2.1 Iris-virginica 6.3 2.9 5.6 1.8 Iris-virginica 6.5 3 5.8 2.2 Iris-virginica 7.6 3 6.6 2.1 Iris-virginica 4.9 2.5 4.5 1.7 Iris-virginica 7.3 2.9 6.3 1.8 Iris-virginica 6.7 2.5 5.8 1.8 Iris-virginica 7.2 3.6 6.1 2.5 Iris-virginica 6.5 3.2 5.1 2 Iris-virginica 6.4 2.7 5.3 1.9 Iris-virginica 6.8 3 5.5 2.1 Iris-virginica 5.7 2.5 5 2 Iris-virginica 5.8 2.8 5.1 2.4 Iris-virginica 6.4 3.2 5.3 2.3 Iris-virginica 6.5 3 5.5 1.8 Iris-virginica 7.7 3.8 6.7 2.2 Iris-virginica 7.7 2.6 6.9 2.3 Iris-virginica 6 2.2 5 1.5 Iris-virginica 6.9 3.2 5.7 2.3 Iris-virginica 5.6 2.8 4.9 2 Iris-virginica 7.7 2.8 6.7 2 Iris-virginica 6.3 2.7 4.9 1.8 Iris-virginica 6.7 3.3 5.7 2.1 Iris-virginica 7.2 3.2 6 1.8 Iris-virginica 6.2 2.8 4.8 1.8 Iris-virginica 6.1 3 4.9 1.8 Iris-virginica 6.4 2.8 5.6 2.1 Iris-virginica 7.2 3 5.8 1.6 Iris-virginica 7.4 2.8 6.1 1.9 Iris-virginica 7.9 3.8 6.4 2 Iris-virginica 6.4 2.8 5.6 2.2 Iris-virginica 6.3 2.8 5.1 1.5 Iris-virginica 6.1 2.6 5.6 1.4 Iris-virginica 7.7 3 6.1 2.3 Iris-virginica 6.3 3.4 5.6 2.4 Iris-virginica 6.4 3.1 5.5 1.8 Iris-virginica 6 3 4.8 1.8 Iris-virginica 6.9 3.1 5.4 2.1 Iris-virginica 6.7 3.1 5.6 2.4 Iris-virginica 6.9 3.1 5.1 2.3 Iris-virginica 5.8 2.7 5.1 1.9 Iris-virginica 6.8 3.2 5.9 2.3 Iris-virginica 6.7 3.3 5.7 2.5 Iris-virginica 6.7 3 5.2 2.3 Iris-virginica 6.3 2.5 5 1.9 Iris-virginica 6.5 3 5.2 2 Iris-virginica 6.2 3.4 5.4 2.3 Iris-virginica 5.9 3 5.1 1.8 Iris-virginica red-data-tools-YouPlot-08da630/test/fixtures/colors.txt000066400000000000000000000151041520446126500231710ustar00rootroot00000000000000black â— red â— green â— yellow â— blue â— magenta â— cyan â— white â— gray â— light_black â— light_red â— light_green â— light_yellow â— light_blue â— light_magenta â— light_cyan â— normal â— default â— bold â— underline â— blink â— reverse â— hidden â— nothing â— 0 â— 1 â— 2 â— 3 â— 4 â— 5 â— 6 â— 7 â— 8 â— 9 â— 10 â— 11 â— 12 â— 13 â— 14 â— 15 â— 16 â— 17 â— 18 â— 19 â— 20 â— 21 â— 22 â— 23 â— 24 â— 25 â— 26 â— 27 â— 28 â— 29 â— 30 â— 31 â— 32 â— 33 â— 34 â— 35 â— 36 â— 37 â— 38 â— 39 â— 40 â— 41 â— 42 â— 43 â— 44 â— 45 â— 46 â— 47 â— 48 â— 49 â— 50 â— 51 â— 52 â— 53 â— 54 â— 55 â— 56 â— 57 â— 58 â— 59 â— 60 â— 61 â— 62 â— 63 â— 64 â— 65 â— 66 â— 67 â— 68 â— 69 â— 70 â— 71 â— 72 â— 73 â— 74 â— 75 â— 76 â— 77 â— 78 â— 79 â— 80 â— 81 â— 82 â— 83 â— 84 â— 85 â— 86 â— 87 â— 88 â— 89 â— 90 â— 91 â— 92 â— 93 â— 94 â— 95 â— 96 â— 97 â— 98 â— 99 â— 100 â— 101 â— 102 â— 103 â— 104 â— 105 â— 106 â— 107 â— 108 â— 109 â— 110 â— 111 â— 112 â— 113 â— 114 â— 115 â— 116 â— 117 â— 118 â— 119 â— 120 â— 121 â— 122 â— 123 â— 124 â— 125 â— 126 â— 127 â— 128 â— 129 â— 130 â— 131 â— 132 â— 133 â— 134 â— 135 â— 136 â— 137 â— 138 â— 139 â— 140 â— 141 â— 142 â— 143 â— 144 â— 145 â— 146 â— 147 â— 148 â— 149 â— 150 â— 151 â— 152 â— 153 â— 154 â— 155 â— 156 â— 157 â— 158 â— 159 â— 160 â— 161 â— 162 â— 163 â— 164 â— 165 â— 166 â— 167 â— 168 â— 169 â— 170 â— 171 â— 172 â— 173 â— 174 â— 175 â— 176 â— 177 â— 178 â— 179 â— 180 â— 181 â— 182 â— 183 â— 184 â— 185 â— 186 â— 187 â— 188 â— 189 â— 190 â— 191 â— 192 â— 193 â— 194 â— 195 â— 196 â— 197 â— 198 â— 199 â— 200 â— 201 â— 202 â— 203 â— 204 â— 205 â— 206 â— 207 â— 208 â— 209 â— 210 â— 211 â— 212 â— 213 â— 214 â— 215 â— 216 â— 217 â— 218 â— 219 â— 220 â— 221 â— 222 â— 223 â— 224 â— 225 â— 226 â— 227 â— 228 â— 229 â— 230 â— 231 â— 232 â— 233 â— 234 â— 235 â— 236 â— 237 â— 238 â— 239 â— 240 â— 241 â— 242 â— 243 â— 244 â— 245 â— 246 â— 247 â— 248 â— 249 â— 250 â— 251 â— 252 â— 253 â— 254 â— 255 â— red-data-tools-YouPlot-08da630/test/fixtures/integer-barplot.txt000066400000000000000000000006071520446126500247700ustar00rootroot00000000000000 ┌ â” a ┤■■■■■■■■■ 3 b ┤■■■■■■■■■■■■■■■■■■■■■ 7 c ┤■■■■■■■■■■■■■■■■■■■■■■■■■■■■■■■■■■■■ 12 â”” ┘ red-data-tools-YouPlot-08da630/test/fixtures/integer-like-float-barplot.txt000066400000000000000000000006011520446126500270070ustar00rootroot00000000000000 ┌ â” a ┤■■■■■■■■■ 3.0 b ┤■■■■■■■■■■■■■■■■■■■■ 7.0 c ┤■■■■■■■■■■■■■■■■■■■■■■■■■■■■■■■■■■ 12.0 â”” ┘ red-data-tools-YouPlot-08da630/test/fixtures/integer-like-float.tsv000066400000000000000000000000231520446126500253410ustar00rootroot00000000000000a 3.0 b 7.0 c 12.0 red-data-tools-YouPlot-08da630/test/fixtures/integer.tsv000066400000000000000000000000151520446126500233150ustar00rootroot00000000000000a 3 b 7 c 12 red-data-tools-YouPlot-08da630/test/fixtures/iris-barplot.txt000066400000000000000000000360101520446126500242760ustar00rootroot00000000000000 IRIS-BARPLOT ┌ â” 5.1 ┤■■■■■■■■■■■■■■■■■■■■■■■■■■■■ 3.5 4.9 ┤■■■■■■■■■■■■■■■■■■■■■■■■ 3.0 4.7 ┤■■■■■■■■■■■■■■■■■■■■■■■■■ 3.2 4.6 ┤■■■■■■■■■■■■■■■■■■■■■■■■■ 3.1 5.0 ┤■■■■■■■■■■■■■■■■■■■■■■■■■■■■■ 3.6 5.4 ┤■■■■■■■■■■■■■■■■■■■■■■■■■■■■■■■ 3.9 4.6 ┤■■■■■■■■■■■■■■■■■■■■■■■■■■■ 3.4 5.0 ┤■■■■■■■■■■■■■■■■■■■■■■■■■■■ 3.4 4.4 ┤■■■■■■■■■■■■■■■■■■■■■■■ 2.9 4.9 ┤■■■■■■■■■■■■■■■■■■■■■■■■■ 3.1 5.4 ┤■■■■■■■■■■■■■■■■■■■■■■■■■■■■■ 3.7 4.8 ┤■■■■■■■■■■■■■■■■■■■■■■■■■■■ 3.4 4.8 ┤■■■■■■■■■■■■■■■■■■■■■■■■ 3.0 4.3 ┤■■■■■■■■■■■■■■■■■■■■■■■■ 3.0 5.8 ┤■■■■■■■■■■■■■■■■■■■■■■■■■■■■■■■■ 4.0 5.7 ┤■■■■■■■■■■■■■■■■■■■■■■■■■■■■■■■■■■■ 4.4 5.4 ┤■■■■■■■■■■■■■■■■■■■■■■■■■■■■■■■ 3.9 5.1 ┤■■■■■■■■■■■■■■■■■■■■■■■■■■■■ 3.5 5.7 ┤■■■■■■■■■■■■■■■■■■■■■■■■■■■■■■ 3.8 5.1 ┤■■■■■■■■■■■■■■■■■■■■■■■■■■■■■■ 3.8 5.4 ┤■■■■■■■■■■■■■■■■■■■■■■■■■■■ 3.4 5.1 ┤■■■■■■■■■■■■■■■■■■■■■■■■■■■■■ 3.7 4.6 ┤■■■■■■■■■■■■■■■■■■■■■■■■■■■■■ 3.6 5.1 ┤■■■■■■■■■■■■■■■■■■■■■■■■■■ 3.3 4.8 ┤■■■■■■■■■■■■■■■■■■■■■■■■■■■ 3.4 5.0 ┤■■■■■■■■■■■■■■■■■■■■■■■■ 3.0 5.0 ┤■■■■■■■■■■■■■■■■■■■■■■■■■■■ 3.4 5.2 ┤■■■■■■■■■■■■■■■■■■■■■■■■■■■■ 3.5 5.2 ┤■■■■■■■■■■■■■■■■■■■■■■■■■■■ 3.4 4.7 ┤■■■■■■■■■■■■■■■■■■■■■■■■■ 3.2 4.8 ┤■■■■■■■■■■■■■■■■■■■■■■■■■ 3.1 5.4 ┤■■■■■■■■■■■■■■■■■■■■■■■■■■■ 3.4 5.2 ┤■■■■■■■■■■■■■■■■■■■■■■■■■■■■■■■■■ 4.1 5.5 ┤■■■■■■■■■■■■■■■■■■■■■■■■■■■■■■■■■ 4.2 4.9 ┤■■■■■■■■■■■■■■■■■■■■■■■■■ 3.1 5.0 ┤■■■■■■■■■■■■■■■■■■■■■■■■■ 3.2 5.5 ┤■■■■■■■■■■■■■■■■■■■■■■■■■■■■ 3.5 4.9 ┤■■■■■■■■■■■■■■■■■■■■■■■■■ 3.1 4.4 ┤■■■■■■■■■■■■■■■■■■■■■■■■ 3.0 5.1 ┤■■■■■■■■■■■■■■■■■■■■■■■■■■■ 3.4 5.0 ┤■■■■■■■■■■■■■■■■■■■■■■■■■■■■ 3.5 4.5 ┤■■■■■■■■■■■■■■■■■■ 2.3 4.4 ┤■■■■■■■■■■■■■■■■■■■■■■■■■ 3.2 5.0 ┤■■■■■■■■■■■■■■■■■■■■■■■■■■■■ 3.5 5.1 ┤■■■■■■■■■■■■■■■■■■■■■■■■■■■■■■ 3.8 4.8 ┤■■■■■■■■■■■■■■■■■■■■■■■■ 3.0 5.1 ┤■■■■■■■■■■■■■■■■■■■■■■■■■■■■■■ 3.8 4.6 ┤■■■■■■■■■■■■■■■■■■■■■■■■■ 3.2 5.3 ┤■■■■■■■■■■■■■■■■■■■■■■■■■■■■■ 3.7 5.0 ┤■■■■■■■■■■■■■■■■■■■■■■■■■■ 3.3 7.0 ┤■■■■■■■■■■■■■■■■■■■■■■■■■ 3.2 6.4 ┤■■■■■■■■■■■■■■■■■■■■■■■■■ 3.2 6.9 ┤■■■■■■■■■■■■■■■■■■■■■■■■■ 3.1 5.5 ┤■■■■■■■■■■■■■■■■■■ 2.3 6.5 ┤■■■■■■■■■■■■■■■■■■■■■■ 2.8 5.7 ┤■■■■■■■■■■■■■■■■■■■■■■ 2.8 6.3 ┤■■■■■■■■■■■■■■■■■■■■■■■■■■ 3.3 4.9 ┤■■■■■■■■■■■■■■■■■■■ 2.4 6.6 ┤■■■■■■■■■■■■■■■■■■■■■■■ 2.9 5.2 ┤■■■■■■■■■■■■■■■■■■■■■ 2.7 5.0 ┤■■■■■■■■■■■■■■■■ 2.0 5.9 ┤■■■■■■■■■■■■■■■■■■■■■■■■ 3.0 6.0 ┤■■■■■■■■■■■■■■■■■■ 2.2 6.1 ┤■■■■■■■■■■■■■■■■■■■■■■■ 2.9 5.6 ┤■■■■■■■■■■■■■■■■■■■■■■■ 2.9 6.7 ┤■■■■■■■■■■■■■■■■■■■■■■■■■ 3.1 5.6 ┤■■■■■■■■■■■■■■■■■■■■■■■■ 3.0 5.8 ┤■■■■■■■■■■■■■■■■■■■■■ 2.7 6.2 ┤■■■■■■■■■■■■■■■■■■ 2.2 5.6 ┤■■■■■■■■■■■■■■■■■■■■ 2.5 5.9 ┤■■■■■■■■■■■■■■■■■■■■■■■■■ 3.2 6.1 ┤■■■■■■■■■■■■■■■■■■■■■■ 2.8 6.3 ┤■■■■■■■■■■■■■■■■■■■■ 2.5 6.1 ┤■■■■■■■■■■■■■■■■■■■■■■ 2.8 6.4 ┤■■■■■■■■■■■■■■■■■■■■■■■ 2.9 6.6 ┤■■■■■■■■■■■■■■■■■■■■■■■■ 3.0 6.8 ┤■■■■■■■■■■■■■■■■■■■■■■ 2.8 6.7 ┤■■■■■■■■■■■■■■■■■■■■■■■■ 3.0 6.0 ┤■■■■■■■■■■■■■■■■■■■■■■■ 2.9 5.7 ┤■■■■■■■■■■■■■■■■■■■■■ 2.6 5.5 ┤■■■■■■■■■■■■■■■■■■■ 2.4 5.5 ┤■■■■■■■■■■■■■■■■■■■ 2.4 5.8 ┤■■■■■■■■■■■■■■■■■■■■■ 2.7 6.0 ┤■■■■■■■■■■■■■■■■■■■■■ 2.7 5.4 ┤■■■■■■■■■■■■■■■■■■■■■■■■ 3.0 6.0 ┤■■■■■■■■■■■■■■■■■■■■■■■■■■■ 3.4 6.7 ┤■■■■■■■■■■■■■■■■■■■■■■■■■ 3.1 6.3 ┤■■■■■■■■■■■■■■■■■■ 2.3 5.6 ┤■■■■■■■■■■■■■■■■■■■■■■■■ 3.0 5.5 ┤■■■■■■■■■■■■■■■■■■■■ 2.5 5.5 ┤■■■■■■■■■■■■■■■■■■■■■ 2.6 6.1 ┤■■■■■■■■■■■■■■■■■■■■■■■■ 3.0 5.8 ┤■■■■■■■■■■■■■■■■■■■■■ 2.6 5.0 ┤■■■■■■■■■■■■■■■■■■ 2.3 5.6 ┤■■■■■■■■■■■■■■■■■■■■■ 2.7 5.7 ┤■■■■■■■■■■■■■■■■■■■■■■■■ 3.0 5.7 ┤■■■■■■■■■■■■■■■■■■■■■■■ 2.9 6.2 ┤■■■■■■■■■■■■■■■■■■■■■■■ 2.9 5.1 ┤■■■■■■■■■■■■■■■■■■■■ 2.5 5.7 ┤■■■■■■■■■■■■■■■■■■■■■■ 2.8 6.3 ┤■■■■■■■■■■■■■■■■■■■■■■■■■■ 3.3 5.8 ┤■■■■■■■■■■■■■■■■■■■■■ 2.7 7.1 ┤■■■■■■■■■■■■■■■■■■■■■■■■ 3.0 6.3 ┤■■■■■■■■■■■■■■■■■■■■■■■ 2.9 6.5 ┤■■■■■■■■■■■■■■■■■■■■■■■■ 3.0 7.6 ┤■■■■■■■■■■■■■■■■■■■■■■■■ 3.0 4.9 ┤■■■■■■■■■■■■■■■■■■■■ 2.5 7.3 ┤■■■■■■■■■■■■■■■■■■■■■■■ 2.9 6.7 ┤■■■■■■■■■■■■■■■■■■■■ 2.5 7.2 ┤■■■■■■■■■■■■■■■■■■■■■■■■■■■■■ 3.6 6.5 ┤■■■■■■■■■■■■■■■■■■■■■■■■■ 3.2 6.4 ┤■■■■■■■■■■■■■■■■■■■■■ 2.7 6.8 ┤■■■■■■■■■■■■■■■■■■■■■■■■ 3.0 5.7 ┤■■■■■■■■■■■■■■■■■■■■ 2.5 5.8 ┤■■■■■■■■■■■■■■■■■■■■■■ 2.8 6.4 ┤■■■■■■■■■■■■■■■■■■■■■■■■■ 3.2 6.5 ┤■■■■■■■■■■■■■■■■■■■■■■■■ 3.0 7.7 ┤■■■■■■■■■■■■■■■■■■■■■■■■■■■■■■ 3.8 7.7 ┤■■■■■■■■■■■■■■■■■■■■■ 2.6 6.0 ┤■■■■■■■■■■■■■■■■■■ 2.2 6.9 ┤■■■■■■■■■■■■■■■■■■■■■■■■■ 3.2 5.6 ┤■■■■■■■■■■■■■■■■■■■■■■ 2.8 7.7 ┤■■■■■■■■■■■■■■■■■■■■■■ 2.8 6.3 ┤■■■■■■■■■■■■■■■■■■■■■ 2.7 6.7 ┤■■■■■■■■■■■■■■■■■■■■■■■■■■ 3.3 7.2 ┤■■■■■■■■■■■■■■■■■■■■■■■■■ 3.2 6.2 ┤■■■■■■■■■■■■■■■■■■■■■■ 2.8 6.1 ┤■■■■■■■■■■■■■■■■■■■■■■■■ 3.0 6.4 ┤■■■■■■■■■■■■■■■■■■■■■■ 2.8 7.2 ┤■■■■■■■■■■■■■■■■■■■■■■■■ 3.0 7.4 ┤■■■■■■■■■■■■■■■■■■■■■■ 2.8 7.9 ┤■■■■■■■■■■■■■■■■■■■■■■■■■■■■■■ 3.8 6.4 ┤■■■■■■■■■■■■■■■■■■■■■■ 2.8 6.3 ┤■■■■■■■■■■■■■■■■■■■■■■ 2.8 6.1 ┤■■■■■■■■■■■■■■■■■■■■■ 2.6 7.7 ┤■■■■■■■■■■■■■■■■■■■■■■■■ 3.0 6.3 ┤■■■■■■■■■■■■■■■■■■■■■■■■■■■ 3.4 6.4 ┤■■■■■■■■■■■■■■■■■■■■■■■■■ 3.1 6.0 ┤■■■■■■■■■■■■■■■■■■■■■■■■ 3.0 6.9 ┤■■■■■■■■■■■■■■■■■■■■■■■■■ 3.1 6.7 ┤■■■■■■■■■■■■■■■■■■■■■■■■■ 3.1 6.9 ┤■■■■■■■■■■■■■■■■■■■■■■■■■ 3.1 5.8 ┤■■■■■■■■■■■■■■■■■■■■■ 2.7 6.8 ┤■■■■■■■■■■■■■■■■■■■■■■■■■ 3.2 6.7 ┤■■■■■■■■■■■■■■■■■■■■■■■■■■ 3.3 6.7 ┤■■■■■■■■■■■■■■■■■■■■■■■■ 3.0 6.3 ┤■■■■■■■■■■■■■■■■■■■■ 2.5 6.5 ┤■■■■■■■■■■■■■■■■■■■■■■■■ 3.0 6.2 ┤■■■■■■■■■■■■■■■■■■■■■■■■■■■ 3.4 5.9 ┤■■■■■■■■■■■■■■■■■■■■■■■■ 3.0 â”” ┘ red-data-tools-YouPlot-08da630/test/fixtures/iris-boxplot.txt000066400000000000000000000026061520446126500243260ustar00rootroot00000000000000 IRIS-BOXPLOT ┌ â” â•· ┌──┬──┠╷ sepal_length ├───┤ │ ├───────┤ ╵ └──┴──┘ ╵ â•· ┌┬┠╷ sepal_width ├───┤│├─────┤ ╵ └┴┘ ╵ â•· ┌─────────────┬───┠╷ petal_length ├──┤ │ ├───────┤ ╵ └─────────────┴───┘ ╵ ╷┌───┬──┠╷ petal_width ├┤ │ ├──┤ ╵└───┴──┘ ╵ â•· species ┤ ╵ â”” ┘ 0 4 8 red-data-tools-YouPlot-08da630/test/fixtures/iris-count.txt000066400000000000000000000060151520446126500237650ustar00rootroot00000000000000 sepal_length ┌ â” 5.0 ┤■■■■■■■■■■■■■■■■■■■■■■■■■■■■■■■■■■■■ 10 5.1 ┤■■■■■■■■■■■■■■■■■■■■■■■■■■■■■■■■ 9 6.3 ┤■■■■■■■■■■■■■■■■■■■■■■■■■■■■■■■■ 9 5.7 ┤■■■■■■■■■■■■■■■■■■■■■■■■■■■■■ 8 6.7 ┤■■■■■■■■■■■■■■■■■■■■■■■■■■■■■ 8 5.5 ┤■■■■■■■■■■■■■■■■■■■■■■■■■ 7 5.8 ┤■■■■■■■■■■■■■■■■■■■■■■■■■ 7 6.4 ┤■■■■■■■■■■■■■■■■■■■■■■■■■ 7 4.9 ┤■■■■■■■■■■■■■■■■■■■■■■ 6 5.4 ┤■■■■■■■■■■■■■■■■■■■■■■ 6 5.6 ┤■■■■■■■■■■■■■■■■■■■■■■ 6 6.0 ┤■■■■■■■■■■■■■■■■■■■■■■ 6 6.1 ┤■■■■■■■■■■■■■■■■■■■■■■ 6 4.8 ┤■■■■■■■■■■■■■■■■■■ 5 6.5 ┤■■■■■■■■■■■■■■■■■■ 5 4.6 ┤■■■■■■■■■■■■■■ 4 5.2 ┤■■■■■■■■■■■■■■ 4 6.2 ┤■■■■■■■■■■■■■■ 4 6.9 ┤■■■■■■■■■■■■■■ 4 7.7 ┤■■■■■■■■■■■■■■ 4 4.4 ┤■■■■■■■■■■■ 3 5.9 ┤■■■■■■■■■■■ 3 6.8 ┤■■■■■■■■■■■ 3 7.2 ┤■■■■■■■■■■■ 3 4.7 ┤■■■■■■■ 2 6.6 ┤■■■■■■■ 2 4.3 ┤■■■■ 1 4.5 ┤■■■■ 1 5.3 ┤■■■■ 1 7.0 ┤■■■■ 1 7.1 ┤■■■■ 1 7.3 ┤■■■■ 1 7.4 ┤■■■■ 1 7.6 ┤■■■■ 1 7.9 ┤■■■■ 1 â”” ┘ red-data-tools-YouPlot-08da630/test/fixtures/iris-density.txt000066400000000000000000000030431520446126500243120ustar00rootroot00000000000000 IRIS-DENSITY ┌────────────────────────────────────────┠6.9 │ â–‘ │ sepal_width │ │ petal_length │ â–‘ │ petal_width │ â–‘ â–‘â–‘ │ species │ â–‘ â–‘ │ │ â–‘ │ │ â–‘ â–‘â–‘ â–‘ │ │ â–’â–‘ â–‘ │ │ â–‘ â–‘â–‘ â–‘â–‘ â–‘ â–‘ â–‘â–‘ â–‘â–‘â–‘ │ │ â–‘ â–‘ â–‘ â–‘ │ │ â–‘â–‘ â–‘ â–‘ │ │ â–‘ â–‘â–‘â–‘â–’ â–‘ â–‘ â–‘â–‘â–‘ â–‘ â–‘ │ │ â–‘ â–‘â–‘â–‘â–‘ │ │ │ 0 │ â–‘ ▒░▒▒██ â–’ â–“â–’â–‘â–’â–’â–‘â–‘â–‘ â–‘â–’â–’â–‘ â–’â–‘â–‘ â–‘ â–‘ │ └────────────────────────────────────────┘ 4.3 7.9 sepal_length red-data-tools-YouPlot-08da630/test/fixtures/iris-histogram.txt000066400000000000000000000020021520446126500246220ustar00rootroot00000000000000 IRIS-HISTOGRAM ┌ â” [4.0, 4.5) ┤▇▇▇▇▇ 4 [4.5, 5.0) ┤▇▇▇▇▇▇▇▇▇▇▇▇▇▇▇▇▇▇▇▇ 18 [5.0, 5.5) ┤▇▇▇▇▇▇▇▇▇▇▇▇▇▇▇▇▇▇▇▇▇▇▇▇▇▇▇▇▇▇▇▇▇▇ 30 [5.5, 6.0) ┤▇▇▇▇▇▇▇▇▇▇▇▇▇▇▇▇▇▇▇▇▇▇▇▇▇▇▇▇▇▇▇▇▇▇▇ 31 [6.0, 6.5) ┤▇▇▇▇▇▇▇▇▇▇▇▇▇▇▇▇▇▇▇▇▇▇▇▇▇▇▇▇▇▇▇▇▇▇▇▇ 32 [6.5, 7.0) ┤▇▇▇▇▇▇▇▇▇▇▇▇▇▇▇▇▇▇▇▇▇▇▇▇▇ 22 [7.0, 7.5) ┤▇▇▇▇▇▇▇▇ 7 [7.5, 8.0) ┤▇▇▇▇▇▇▇ 6 â”” ┘ Frequency red-data-tools-YouPlot-08da630/test/fixtures/iris-lineplot.txt000066400000000000000000000050661520446126500244700ustar00rootroot00000000000000 IRIS-LINEPLOT ┌────────────────────────────────────────┠5 │⠀⠀⠀⠀⠀⠀⠀⠀⠀⠀⠀⠀⠀⠀⠀⠀⠀⠀⠀⠀⠀⠀⠀⠀⠀⠀⠀⠀⠀⠀⠀⠀⠀⠀⠀⠀⠀⠀⠀⠀│ │⠀⠀⠀⠀⠀⠀⠀⠀⠀⠀⠀⠀⠀⠀⠀⠀⠀⠀⠀⠀⠀⠀⠀⠀⠀⠀⠀⠀⠀⠀⠀⠀⠀⠀⠀⠀⠀⠀⠀⠀│ │⠀⠀⠀⠀⠀⠀⠀⠀⠀⠀⠀⠀⠀⠀⠀⠀⠀⡀⠀⠀⠀⠀⠀⠀⠀⠀⠀⠀⠀⠀⠀⠀⠀⠀⠀⠀⠀⠀⠀⠀│ │⠀⠀⠀⠀⠀⠀⠀⠀⠀⠀⠀⠀⠀⠀⠀⢀⠎⡇⠀⠀⠀⠀⠀⠀⠀⠀⠀⠀⠀⠀⠀⠀⠀⠀⠀⠀⠀⠀⠀⠀│ │⠀⠀⠀⠀⠀⠀⠀⠀⠀⠀⠀⠀⡔⠒⣽⠋⠀⢸⠀⠀⠀⠀⠀⠀⠀⠀⠀⠀⠀⠀⠀⠀⠀⠀⠀⠀⠀⠀⠀⠀│ │⠀⠀⠀⠀⠀⠀⠀⠀⠀⠀⠀⠀⢣⣼⠇⡠⠠⠊â â €â €â €â €â €â €â €â €â €â €â €â €â €â €â €â €â €â €â €â €â €â”‚ │⠀⠀⠀⠀⠀⢀⣀⣀⠤⢤⣼⢿⣿⣿⠯⠛⠉â â €â €â €â €â €â €â €â €â €â €â €â €â €â €â €â €â¢€â ¤â¢Šâ¡§â¡ºâ â”‚ sepal_width │⠀⠀⠀⠀⠀⠈⢑⠦⣺⣵⣿⣿â¡â¢µâ¡ â †â €â €â €â €â €â €â €â €â €â €â €â €â €â¡ â ”⣺⠥⢊⠥⠊â â¡·â â €â”‚ │⠀⠀⠀⠀⢀⡨⡽⣿⣯⢟⣿⡯⠿⠭⠥⠤⠤⢤⠤⠮â¢â£•⣣â£â£‰â£’⣦⣶⣭⣤⣺⣥⠊â â €â €â¡°â¡‡â €â €â”‚ │⠀⠀⠀⡠⣗⣭⣞⣿⣾⣟⡇⠀⠀⠀⢀⠤⢊â£â£°â££â£¾â£Ÿâ£¥â£¾â£¿â£½â¢¿â£¿â¡¿â¡¿â ›â ‰â “⠢⠤⣴â£â¡‡â €â €â”‚ │⠀⠀⠈⠉⡟⠋⠉â¡â €â ‰â â €â €â €â ‰â¢ºâ£·â£·â¢¿â£¿â£¿â£¿â£·â£¾â£¿â£¿â£¿â£¿â£¿â£¿â£¯â¢¿â¡¿â¢Ÿâ¡»â ‹â ‰â¡‡â €â €â”‚ │⠀⠀⠀⠀⢱⠀⡰â â €â €â €â¢€â¢–⣶⣾⣿⣿⣻⡿⣿⣿⣿⣿⢿⣿⠟⠛⢻⢛⡻⠛⠉⠉⠉⠉⠉⠉⡇⠀⠀│ │⠀⠀⠀⠀⢸⢠⠃⠀⠀⢔⣶⡾⡿⣟⡿⢿⠷⣟⡿⢿⡟⢅⡱â¢â Žâ €â €â —â¢â£€â£€â ¤â ¤â ’⠒⠉⠉â â €â €â”‚ │⠀⠀⠀⠀⠸⠇⠀⠀⠀â â¢´â ‹â¡©â Šâ €â —â ‹â â ‰â¢ºâ£·â£Žâ¡±â ®â ”â ’â Šâ ‰â â €â €â €â €â €â €â €â €â €â €â €â”‚ 2 │⠀⠀⠀⠀⠀⠀⠀⠀⠀⠀⡮⠊⠀⠀⠀⠀⠀⠀⠀⠀â â ˆâ â €â €â €â €â €â €â €â €â €â €â €â €â €â €â €â €â €â”‚ └────────────────────────────────────────┘ 4 8 sepal_length red-data-tools-YouPlot-08da630/test/fixtures/iris-lineplots.txt000066400000000000000000000050721520446126500246500ustar00rootroot00000000000000 IRIS-LINEPLOTS ┌────────────────────────────────────────┠6.9 │⠀⠀⠀⠀⠀⠀⠀⠀⠀⠀⠀⠀⠀⠀⠀⠀⠀⠀⠀⠀⠀⠀⠀⠀⠀⠀⠀⠀⠀⠀⠀⠀⠀⣀⣠⣴⡮⠟⠀⠀│ sepal_width │⠀⠀⠀⠀⠀⠀⠀⠀⠀⠀⠀⠀⠀⠀⠀⠀⠀⠀⠀⠀⠀⠀⡀⠀⠀⠀⠀⣀⣀⣤⣴⣶⣿⣟⣯⣥⣔⣲⠊⠉│ petal_length │⠀⠀⠀⠀⠀⠀⠀⠀⠀⠀⠀⠀⠀⠀⠀⠀⠀⠀⠀⢀⣔⢾⣥⣤⣶⣿⣿⣿⣿⠿⠛⠛⠋⠉⠀⠀⠀⠀⠀⠀│ petal_width │⠀⠀⠀⠀⠀⠀⠀⠀⠀⠀⠀⠀⠀⠀⠀⣀⣠⣤⣾⣿⣿⣿⣿⣿⣿⣿⣿⣛⣗⠀⠀⠀⠀⠀⠀⠀⠀⠀⠀⠀│ species │⠀⠀⠀⠀⠀⠀⠀⠀⣀⣀⠤⠔⠒⣋⡻⠭⠛⣩⡿⣟⣷⣽⣫⣥⣒⣲⣭⣶⣒⣀⠀⠀⠀⠀⠀⠀⠀⠀⠀⠀│ │⠀⠀⠀⠀⠀⠀⠈⠉⠀⠀⠀⢀⣉⡟⣛⣿â£â£»â£¿â£¿â£¿â ¿â¢¿â£¿â¡¿â ¿â£›â ¤â Šâ â €â €â €â €â €â €â €â €â €â €â”‚ │⠀⠀⠀⠀⠀⠀⠀⢀⣠⣤⣿⣷⣿⣿⣿⣿⣿⠿⠿⠛⠋⠉â â£€â ”⠊⠀⠀⠀⠀⠀⠀⠀⠀⠀⢀⣀⣠⢀⣠│ │⠀⢀⣀⣭⣿⣿⣿⣿⣿⣿⣿⣿⣽⣖⣋⣙⣀⣀⣤⣤⣤⣔⣮⣤⣄⣀⣀⣤⣤⣔⣶⣾⡳⠮â â “⢊⢽⠋⠀│ │⠒⢷⠿⠿⢛⠟⠛⠙⠑⠚⠉⠀⠲⣶⣿⣿⣶⣿⣷⣿⣿⣷⣿⣿⣿⣿⣿⣿⣿⣿⣿⣿⣿⣷⣶⣶⣷⣾⠀⠀│ │⠀⠸⡠⠔â â €â¢ â¡¤â£´â£¶â£¿â£¿â ¿â£¿â£¿â£¿â¢¿â£¿â£¿â£¿â£¿â£¿â£Ÿâ£Ÿâ£‰â£‰â£©â£›â£›â£­â£­â£¥â£¤â£¤â£”⣒⣒⡚⠀⠀│ │⠀⠀â â €â €â¢€â¡€â ¨â¢žâ Šâ¢‰â¡ â ”⠉⠤⠴⢥⣴⣾⣿⣿⣿⣿⣿⣿⣿⣿⣿⣿⣶⣷⣶⣶⣶⣶⣿⣿⡭⠤⠤│ │⠀⣀⣀⣄⣤⣤⣽⣿⣿⣿⣿⣿⣿⡿⣿⣿⣽⣽⣯⣭⣿⣿⣿⣿⣿⣿⣿⣭⣭⣉⠛⠛â â ‰â €â €â €â €â €â €â”‚ │⠤⠿⠿⡯⠽⠿⢭⣽⣶⡾⠿⠿⠿⣿⠿⣿⢟⠿⢻⠟⠛⣛⣛⠯⠭â â ’â Šâ ‰â â €â €â €â €â €â €â €â €â €â €â”‚ │⠀⠀⠀⠀⠀⢀⣀⡠⣀⠀⠀⠀⢀⣀⡠⠤⠤⠒⠒⠉⠉⠀⠀⠀⠀⠀⠀⠀⠀⠀⠀⠀⠀⠀⠀⠀⠀⠀⠀⠀│ 0 │⣀⣴⣶⣾⣿⣷⣿⣿⣿⣿⣿⣿⣿⣿⣿⣿⣦⣀⣀⣀⣀⣀⣀⣀⣀⣀⣀⣀⣀⣀⣀⣀⣀⣀⣀⣀⣀⣀⣀⣀│ └────────────────────────────────────────┘ 4.3 7.9 sepal_length red-data-tools-YouPlot-08da630/test/fixtures/iris-scatter.txt000066400000000000000000000050711520446126500243030ustar00rootroot00000000000000 IRIS-SCATTER ┌────────────────────────────────────────┠6.9 │⠀⠀⠀⠀⠀⠀⠀⠀⠀⠀⠀⠀⠀⠀⠀⠀⠀⠀⠀⠀⠀⠀⠀⠀⠀⠀⠀⠀⠀⠀⠀⠀⠀⠀⠀⠀⠠⠘⠀⠀│ sepal_width │⠀⠀⠀⠀⠀⠀⠀⠀⠀⠀⠀⠀⠀⠀⠀⠀⠀⠀⠀⠀⠀⠀⡀⠀⠀⠀⠀⠀⠀⠀⠀⠀⡄⠂⠄⠀⠀⠠⠀⠈│ petal_length │⠀⠀⠀⠀⠀⠀⠀⠀⠀⠀⠀⠀⠀⠀⠀⠀⠀⠀⠀⢀⠀⠀⡀⡀⠂⠀⢰⠈⠠⠀⠀â â ‚⠀⠀⠀⠀⠀⠀⠀│ petal_width │⠀⠀⠀⠀⠀⠀⠀⠀⠀⠀⠀⠀⠀⠀⠀⠀⢀⢀⢀⠀⠀⠂⡀⠃⡅⠀⠠⠈â¢â €â €â €â €â €â €â €â €â €â €â €â”‚ species │⠀⠀⠀⠀⠀⠀⠀⠀⠀⠀⠀⠀⠀⠀⠂⠈⠀⠠⠨â¢â €â „⡃⠀⠀⠀⢈⠠â â¢€â €â €â €â €â €â €â €â €â €â €â”‚ │⠀⠀⠀⠀⠀⠀⠈⠀⠀⠀⠀⠀â â¡‚â¡â¢˜â €â¢€â ˆâ ˆâ €â …â ‚â …â â ˜â â €â €â €â €â €â €â €â €â €â €â €â €â €â”‚ │⠀⠀⠀⠀⠀⠀⠀⠀⢠⠀⠅⡀⡄⡆⠅⠨⠸⠀â â â €â €â €â €â €â €â €â €â €â €â €â €â €â €â €â €â €â  â €â  â”‚ │⠀⠀⠀⠅⠀⠠⢀⢸⢰⠀⠆⠀⠄⠂â â â €â €â  â €â €â „⡄⠀⠀⠀⢀⠀⠀⠀⠀⠀â â €â €â €â €â €â €â €â”‚ │⠂⠇⠀⠃â â â â ˜â â €â €â €â ‚⠀⡆⢰⢀⠘⠰⢰⠀⡄⡄⡇⡃⠰â â¢˜â ˜â ˆâ €â ‚⠃⠄⡀⠀â â¢â €â €â”‚ │⠀⠀⠀⠀⠀⠀⢠⠀⠠⠀â â €â €â¡†â …⠰⢘⠀⠈â â €â €â¡…â â €â €â¢ â €â €â €â €â €â „⠀⠀⠀⠀â â €â €â”‚ │⠀⠀â â €â €â¢€â €â ¨â¢€â €â €â €â €â â „⠠⢀⠀⠈⠀⠀â â¡â¡ƒâ …⠀⠘⠘⠘⠀⠀⠂⠀⠀⡀⠀â â ¨â €â  â”‚ │⠀⡀⠀⡄⠄⢠⢰⢠⢰⠀⡄⠄⠆⡀⠄⠰⠀⠨⠨⢈⠀⠅⠅⠅⠅⢀⢸⢀⠠⢀⠀⠀⠅â â €â €â €â €â €â €â”‚ │⠄â â â¡€â â €â¢€â¢˜â  â €â €â €â â¡‡â …⢘â¢â €â¢€â ˜â €â â â â €â ˆâ €â €â €â €â €â €â €â €â €â €â €â €â €â €â”‚ │⠀⠀⠀⠀⠀⠀⠀⠠⢀⠀⠀⠀⠀⠀⠀⠀⠀⠀⠀⠀⠀⠀⠀⠀⠀⠀⠀⠀⠀⠀⠀⠀⠀⠀⠀⠀⠀⠀⠀⠀│ 0 │⡀⡄⡂⡆⡄⢰⢠⢸⢸⠀⡄⡄⡅⡄⡀⢘⢠⢀⢀⢀⠀⡀⡀⡀⡀⢀⢀⢀⢀⢀⠀⡀⡀⡀⡀⠀⢀⢀⠀⢀│ └────────────────────────────────────────┘ 4.3 7.9 sepal_length red-data-tools-YouPlot-08da630/test/fixtures/iris.csv000066400000000000000000000110011520446126500226020ustar00rootroot00000000000000sepal_length,sepal_width,petal_length,petal_width,species 5.1,3.5,1.4,0.2,Iris-setosa 4.9,3.0,1.4,0.2,Iris-setosa 4.7,3.2,1.3,0.2,Iris-setosa 4.6,3.1,1.5,0.2,Iris-setosa 5.0,3.6,1.4,0.2,Iris-setosa 5.4,3.9,1.7,0.4,Iris-setosa 4.6,3.4,1.4,0.3,Iris-setosa 5.0,3.4,1.5,0.2,Iris-setosa 4.4,2.9,1.4,0.2,Iris-setosa 4.9,3.1,1.5,0.1,Iris-setosa 5.4,3.7,1.5,0.2,Iris-setosa 4.8,3.4,1.6,0.2,Iris-setosa 4.8,3.0,1.4,0.1,Iris-setosa 4.3,3.0,1.1,0.1,Iris-setosa 5.8,4.0,1.2,0.2,Iris-setosa 5.7,4.4,1.5,0.4,Iris-setosa 5.4,3.9,1.3,0.4,Iris-setosa 5.1,3.5,1.4,0.3,Iris-setosa 5.7,3.8,1.7,0.3,Iris-setosa 5.1,3.8,1.5,0.3,Iris-setosa 5.4,3.4,1.7,0.2,Iris-setosa 5.1,3.7,1.5,0.4,Iris-setosa 4.6,3.6,1.0,0.2,Iris-setosa 5.1,3.3,1.7,0.5,Iris-setosa 4.8,3.4,1.9,0.2,Iris-setosa 5.0,3.0,1.6,0.2,Iris-setosa 5.0,3.4,1.6,0.4,Iris-setosa 5.2,3.5,1.5,0.2,Iris-setosa 5.2,3.4,1.4,0.2,Iris-setosa 4.7,3.2,1.6,0.2,Iris-setosa 4.8,3.1,1.6,0.2,Iris-setosa 5.4,3.4,1.5,0.4,Iris-setosa 5.2,4.1,1.5,0.1,Iris-setosa 5.5,4.2,1.4,0.2,Iris-setosa 4.9,3.1,1.5,0.1,Iris-setosa 5.0,3.2,1.2,0.2,Iris-setosa 5.5,3.5,1.3,0.2,Iris-setosa 4.9,3.1,1.5,0.1,Iris-setosa 4.4,3.0,1.3,0.2,Iris-setosa 5.1,3.4,1.5,0.2,Iris-setosa 5.0,3.5,1.3,0.3,Iris-setosa 4.5,2.3,1.3,0.3,Iris-setosa 4.4,3.2,1.3,0.2,Iris-setosa 5.0,3.5,1.6,0.6,Iris-setosa 5.1,3.8,1.9,0.4,Iris-setosa 4.8,3.0,1.4,0.3,Iris-setosa 5.1,3.8,1.6,0.2,Iris-setosa 4.6,3.2,1.4,0.2,Iris-setosa 5.3,3.7,1.5,0.2,Iris-setosa 5.0,3.3,1.4,0.2,Iris-setosa 7.0,3.2,4.7,1.4,Iris-versicolor 6.4,3.2,4.5,1.5,Iris-versicolor 6.9,3.1,4.9,1.5,Iris-versicolor 5.5,2.3,4.0,1.3,Iris-versicolor 6.5,2.8,4.6,1.5,Iris-versicolor 5.7,2.8,4.5,1.3,Iris-versicolor 6.3,3.3,4.7,1.6,Iris-versicolor 4.9,2.4,3.3,1.0,Iris-versicolor 6.6,2.9,4.6,1.3,Iris-versicolor 5.2,2.7,3.9,1.4,Iris-versicolor 5.0,2.0,3.5,1.0,Iris-versicolor 5.9,3.0,4.2,1.5,Iris-versicolor 6.0,2.2,4.0,1.0,Iris-versicolor 6.1,2.9,4.7,1.4,Iris-versicolor 5.6,2.9,3.6,1.3,Iris-versicolor 6.7,3.1,4.4,1.4,Iris-versicolor 5.6,3.0,4.5,1.5,Iris-versicolor 5.8,2.7,4.1,1.0,Iris-versicolor 6.2,2.2,4.5,1.5,Iris-versicolor 5.6,2.5,3.9,1.1,Iris-versicolor 5.9,3.2,4.8,1.8,Iris-versicolor 6.1,2.8,4.0,1.3,Iris-versicolor 6.3,2.5,4.9,1.5,Iris-versicolor 6.1,2.8,4.7,1.2,Iris-versicolor 6.4,2.9,4.3,1.3,Iris-versicolor 6.6,3.0,4.4,1.4,Iris-versicolor 6.8,2.8,4.8,1.4,Iris-versicolor 6.7,3.0,5.0,1.7,Iris-versicolor 6.0,2.9,4.5,1.5,Iris-versicolor 5.7,2.6,3.5,1.0,Iris-versicolor 5.5,2.4,3.8,1.1,Iris-versicolor 5.5,2.4,3.7,1.0,Iris-versicolor 5.8,2.7,3.9,1.2,Iris-versicolor 6.0,2.7,5.1,1.6,Iris-versicolor 5.4,3.0,4.5,1.5,Iris-versicolor 6.0,3.4,4.5,1.6,Iris-versicolor 6.7,3.1,4.7,1.5,Iris-versicolor 6.3,2.3,4.4,1.3,Iris-versicolor 5.6,3.0,4.1,1.3,Iris-versicolor 5.5,2.5,4.0,1.3,Iris-versicolor 5.5,2.6,4.4,1.2,Iris-versicolor 6.1,3.0,4.6,1.4,Iris-versicolor 5.8,2.6,4.0,1.2,Iris-versicolor 5.0,2.3,3.3,1.0,Iris-versicolor 5.6,2.7,4.2,1.3,Iris-versicolor 5.7,3.0,4.2,1.2,Iris-versicolor 5.7,2.9,4.2,1.3,Iris-versicolor 6.2,2.9,4.3,1.3,Iris-versicolor 5.1,2.5,3.0,1.1,Iris-versicolor 5.7,2.8,4.1,1.3,Iris-versicolor 6.3,3.3,6.0,2.5,Iris-virginica 5.8,2.7,5.1,1.9,Iris-virginica 7.1,3.0,5.9,2.1,Iris-virginica 6.3,2.9,5.6,1.8,Iris-virginica 6.5,3.0,5.8,2.2,Iris-virginica 7.6,3.0,6.6,2.1,Iris-virginica 4.9,2.5,4.5,1.7,Iris-virginica 7.3,2.9,6.3,1.8,Iris-virginica 6.7,2.5,5.8,1.8,Iris-virginica 7.2,3.6,6.1,2.5,Iris-virginica 6.5,3.2,5.1,2.0,Iris-virginica 6.4,2.7,5.3,1.9,Iris-virginica 6.8,3.0,5.5,2.1,Iris-virginica 5.7,2.5,5.0,2.0,Iris-virginica 5.8,2.8,5.1,2.4,Iris-virginica 6.4,3.2,5.3,2.3,Iris-virginica 6.5,3.0,5.5,1.8,Iris-virginica 7.7,3.8,6.7,2.2,Iris-virginica 7.7,2.6,6.9,2.3,Iris-virginica 6.0,2.2,5.0,1.5,Iris-virginica 6.9,3.2,5.7,2.3,Iris-virginica 5.6,2.8,4.9,2.0,Iris-virginica 7.7,2.8,6.7,2.0,Iris-virginica 6.3,2.7,4.9,1.8,Iris-virginica 6.7,3.3,5.7,2.1,Iris-virginica 7.2,3.2,6.0,1.8,Iris-virginica 6.2,2.8,4.8,1.8,Iris-virginica 6.1,3.0,4.9,1.8,Iris-virginica 6.4,2.8,5.6,2.1,Iris-virginica 7.2,3.0,5.8,1.6,Iris-virginica 7.4,2.8,6.1,1.9,Iris-virginica 7.9,3.8,6.4,2.0,Iris-virginica 6.4,2.8,5.6,2.2,Iris-virginica 6.3,2.8,5.1,1.5,Iris-virginica 6.1,2.6,5.6,1.4,Iris-virginica 7.7,3.0,6.1,2.3,Iris-virginica 6.3,3.4,5.6,2.4,Iris-virginica 6.4,3.1,5.5,1.8,Iris-virginica 6.0,3.0,4.8,1.8,Iris-virginica 6.9,3.1,5.4,2.1,Iris-virginica 6.7,3.1,5.6,2.4,Iris-virginica 6.9,3.1,5.1,2.3,Iris-virginica 5.8,2.7,5.1,1.9,Iris-virginica 6.8,3.2,5.9,2.3,Iris-virginica 6.7,3.3,5.7,2.5,Iris-virginica 6.7,3.0,5.2,2.3,Iris-virginica 6.3,2.5,5.0,1.9,Iris-virginica 6.5,3.0,5.2,2.0,Iris-virginica 6.2,3.4,5.4,2.3,Iris-virginica 5.9,3.0,5.1,1.8,Iris-virginica red-data-tools-YouPlot-08da630/test/fixtures/iris_utf16.csv000066400000000000000000000220041520446126500236340ustar00rootroot00000000000000ÿþsepal_length,sepal_width,petal_length,petal_width,species 5.1,3.5,1.4,0.2,Iris-setosa 4.9,3.0,1.4,0.2,Iris-setosa 4.7,3.2,1.3,0.2,Iris-setosa 4.6,3.1,1.5,0.2,Iris-setosa 5.0,3.6,1.4,0.2,Iris-setosa 5.4,3.9,1.7,0.4,Iris-setosa 4.6,3.4,1.4,0.3,Iris-setosa 5.0,3.4,1.5,0.2,Iris-setosa 4.4,2.9,1.4,0.2,Iris-setosa 4.9,3.1,1.5,0.1,Iris-setosa 5.4,3.7,1.5,0.2,Iris-setosa 4.8,3.4,1.6,0.2,Iris-setosa 4.8,3.0,1.4,0.1,Iris-setosa 4.3,3.0,1.1,0.1,Iris-setosa 5.8,4.0,1.2,0.2,Iris-setosa 5.7,4.4,1.5,0.4,Iris-setosa 5.4,3.9,1.3,0.4,Iris-setosa 5.1,3.5,1.4,0.3,Iris-setosa 5.7,3.8,1.7,0.3,Iris-setosa 5.1,3.8,1.5,0.3,Iris-setosa 5.4,3.4,1.7,0.2,Iris-setosa 5.1,3.7,1.5,0.4,Iris-setosa 4.6,3.6,1.0,0.2,Iris-setosa 5.1,3.3,1.7,0.5,Iris-setosa 4.8,3.4,1.9,0.2,Iris-setosa 5.0,3.0,1.6,0.2,Iris-setosa 5.0,3.4,1.6,0.4,Iris-setosa 5.2,3.5,1.5,0.2,Iris-setosa 5.2,3.4,1.4,0.2,Iris-setosa 4.7,3.2,1.6,0.2,Iris-setosa 4.8,3.1,1.6,0.2,Iris-setosa 5.4,3.4,1.5,0.4,Iris-setosa 5.2,4.1,1.5,0.1,Iris-setosa 5.5,4.2,1.4,0.2,Iris-setosa 4.9,3.1,1.5,0.1,Iris-setosa 5.0,3.2,1.2,0.2,Iris-setosa 5.5,3.5,1.3,0.2,Iris-setosa 4.9,3.1,1.5,0.1,Iris-setosa 4.4,3.0,1.3,0.2,Iris-setosa 5.1,3.4,1.5,0.2,Iris-setosa 5.0,3.5,1.3,0.3,Iris-setosa 4.5,2.3,1.3,0.3,Iris-setosa 4.4,3.2,1.3,0.2,Iris-setosa 5.0,3.5,1.6,0.6,Iris-setosa 5.1,3.8,1.9,0.4,Iris-setosa 4.8,3.0,1.4,0.3,Iris-setosa 5.1,3.8,1.6,0.2,Iris-setosa 4.6,3.2,1.4,0.2,Iris-setosa 5.3,3.7,1.5,0.2,Iris-setosa 5.0,3.3,1.4,0.2,Iris-setosa 7.0,3.2,4.7,1.4,Iris-versicolor 6.4,3.2,4.5,1.5,Iris-versicolor 6.9,3.1,4.9,1.5,Iris-versicolor 5.5,2.3,4.0,1.3,Iris-versicolor 6.5,2.8,4.6,1.5,Iris-versicolor 5.7,2.8,4.5,1.3,Iris-versicolor 6.3,3.3,4.7,1.6,Iris-versicolor 4.9,2.4,3.3,1.0,Iris-versicolor 6.6,2.9,4.6,1.3,Iris-versicolor 5.2,2.7,3.9,1.4,Iris-versicolor 5.0,2.0,3.5,1.0,Iris-versicolor 5.9,3.0,4.2,1.5,Iris-versicolor 6.0,2.2,4.0,1.0,Iris-versicolor 6.1,2.9,4.7,1.4,Iris-versicolor 5.6,2.9,3.6,1.3,Iris-versicolor 6.7,3.1,4.4,1.4,Iris-versicolor 5.6,3.0,4.5,1.5,Iris-versicolor 5.8,2.7,4.1,1.0,Iris-versicolor 6.2,2.2,4.5,1.5,Iris-versicolor 5.6,2.5,3.9,1.1,Iris-versicolor 5.9,3.2,4.8,1.8,Iris-versicolor 6.1,2.8,4.0,1.3,Iris-versicolor 6.3,2.5,4.9,1.5,Iris-versicolor 6.1,2.8,4.7,1.2,Iris-versicolor 6.4,2.9,4.3,1.3,Iris-versicolor 6.6,3.0,4.4,1.4,Iris-versicolor 6.8,2.8,4.8,1.4,Iris-versicolor 6.7,3.0,5.0,1.7,Iris-versicolor 6.0,2.9,4.5,1.5,Iris-versicolor 5.7,2.6,3.5,1.0,Iris-versicolor 5.5,2.4,3.8,1.1,Iris-versicolor 5.5,2.4,3.7,1.0,Iris-versicolor 5.8,2.7,3.9,1.2,Iris-versicolor 6.0,2.7,5.1,1.6,Iris-versicolor 5.4,3.0,4.5,1.5,Iris-versicolor 6.0,3.4,4.5,1.6,Iris-versicolor 6.7,3.1,4.7,1.5,Iris-versicolor 6.3,2.3,4.4,1.3,Iris-versicolor 5.6,3.0,4.1,1.3,Iris-versicolor 5.5,2.5,4.0,1.3,Iris-versicolor 5.5,2.6,4.4,1.2,Iris-versicolor 6.1,3.0,4.6,1.4,Iris-versicolor 5.8,2.6,4.0,1.2,Iris-versicolor 5.0,2.3,3.3,1.0,Iris-versicolor 5.6,2.7,4.2,1.3,Iris-versicolor 5.7,3.0,4.2,1.2,Iris-versicolor 5.7,2.9,4.2,1.3,Iris-versicolor 6.2,2.9,4.3,1.3,Iris-versicolor 5.1,2.5,3.0,1.1,Iris-versicolor 5.7,2.8,4.1,1.3,Iris-versicolor 6.3,3.3,6.0,2.5,Iris-virginica 5.8,2.7,5.1,1.9,Iris-virginica 7.1,3.0,5.9,2.1,Iris-virginica 6.3,2.9,5.6,1.8,Iris-virginica 6.5,3.0,5.8,2.2,Iris-virginica 7.6,3.0,6.6,2.1,Iris-virginica 4.9,2.5,4.5,1.7,Iris-virginica 7.3,2.9,6.3,1.8,Iris-virginica 6.7,2.5,5.8,1.8,Iris-virginica 7.2,3.6,6.1,2.5,Iris-virginica 6.5,3.2,5.1,2.0,Iris-virginica 6.4,2.7,5.3,1.9,Iris-virginica 6.8,3.0,5.5,2.1,Iris-virginica 5.7,2.5,5.0,2.0,Iris-virginica 5.8,2.8,5.1,2.4,Iris-virginica 6.4,3.2,5.3,2.3,Iris-virginica 6.5,3.0,5.5,1.8,Iris-virginica 7.7,3.8,6.7,2.2,Iris-virginica 7.7,2.6,6.9,2.3,Iris-virginica 6.0,2.2,5.0,1.5,Iris-virginica 6.9,3.2,5.7,2.3,Iris-virginica 5.6,2.8,4.9,2.0,Iris-virginica 7.7,2.8,6.7,2.0,Iris-virginica 6.3,2.7,4.9,1.8,Iris-virginica 6.7,3.3,5.7,2.1,Iris-virginica 7.2,3.2,6.0,1.8,Iris-virginica 6.2,2.8,4.8,1.8,Iris-virginica 6.1,3.0,4.9,1.8,Iris-virginica 6.4,2.8,5.6,2.1,Iris-virginica 7.2,3.0,5.8,1.6,Iris-virginica 7.4,2.8,6.1,1.9,Iris-virginica 7.9,3.8,6.4,2.0,Iris-virginica 6.4,2.8,5.6,2.2,Iris-virginica 6.3,2.8,5.1,1.5,Iris-virginica 6.1,2.6,5.6,1.4,Iris-virginica 7.7,3.0,6.1,2.3,Iris-virginica 6.3,3.4,5.6,2.4,Iris-virginica 6.4,3.1,5.5,1.8,Iris-virginica 6.0,3.0,4.8,1.8,Iris-virginica 6.9,3.1,5.4,2.1,Iris-virginica 6.7,3.1,5.6,2.4,Iris-virginica 6.9,3.1,5.1,2.3,Iris-virginica 5.8,2.7,5.1,1.9,Iris-virginica 6.8,3.2,5.9,2.3,Iris-virginica 6.7,3.3,5.7,2.5,Iris-virginica 6.7,3.0,5.2,2.3,Iris-virginica 6.3,2.5,5.0,1.9,Iris-virginica 6.5,3.0,5.2,2.0,Iris-virginica 6.2,3.4,5.4,2.3,Iris-virginica 5.9,3.0,5.1,1.8,Iris-virginica red-data-tools-YouPlot-08da630/test/fixtures/simple-boxplot.txt000066400000000000000000000006711520446126500246510ustar00rootroot00000000000000 ┌ â” â•· ┌──────────┬──────────┠╷ 1 ├───────┤ │ ├────────┤ ╵ └──────────┴──────────┘ ╵ â”” ┘ -50 0 50 red-data-tools-YouPlot-08da630/test/fixtures/simple-count.txt000066400000000000000000000025441520446126500243130ustar00rootroot00000000000000 ┌ â” -50 ┤■■■■■■■■■■■■■■■■■■■■■■■■■■■■■■■■■■■■■ 1 -40 ┤■■■■■■■■■■■■■■■■■■■■■■■■■■■■■■■■■■■■■ 1 -30 ┤■■■■■■■■■■■■■■■■■■■■■■■■■■■■■■■■■■■■■ 1 -20 ┤■■■■■■■■■■■■■■■■■■■■■■■■■■■■■■■■■■■■■ 1 -10 ┤■■■■■■■■■■■■■■■■■■■■■■■■■■■■■■■■■■■■■ 1 10 ┤■■■■■■■■■■■■■■■■■■■■■■■■■■■■■■■■■■■■■ 1 20 ┤■■■■■■■■■■■■■■■■■■■■■■■■■■■■■■■■■■■■■ 1 30 ┤■■■■■■■■■■■■■■■■■■■■■■■■■■■■■■■■■■■■■ 1 40 ┤■■■■■■■■■■■■■■■■■■■■■■■■■■■■■■■■■■■■■ 1 50 ┤■■■■■■■■■■■■■■■■■■■■■■■■■■■■■■■■■■■■■ 1 â”” ┘ red-data-tools-YouPlot-08da630/test/fixtures/simple-histogram-symbol-@.txt000066400000000000000000000010601520446126500266300ustar00rootroot00000000000000 ┌ â” [-60.0, -40.0) ┤@@@@@@@@@@@@@@@@@@@ 1 [-40.0, -20.0) ┤@@@@@@@@@@@@@@@@@@@@@@@@@@@@@@@@@@@@@ 2 [-20.0, 0.0) ┤@@@@@@@@@@@@@@@@@@@@@@@@@@@@@@@@@@@@@ 2 [ 0.0, 20.0) ┤@@@@@@@@@@@@@@@@@@@ 1 [ 20.0, 40.0) ┤@@@@@@@@@@@@@@@@@@@@@@@@@@@@@@@@@@@@@ 2 [ 40.0, 60.0) ┤@@@@@@@@@@@@@@@@@@@@@@@@@@@@@@@@@@@@@ 2 â”” ┘ Frequency red-data-tools-YouPlot-08da630/test/fixtures/simple-histogram.txt000066400000000000000000000016441520446126500251600ustar00rootroot00000000000000 ┌ â” [-60.0, -40.0) ┤▇▇▇▇▇▇▇▇▇▇▇▇▇▇▇▇▇▇▇ 1 [-40.0, -20.0) ┤▇▇▇▇▇▇▇▇▇▇▇▇▇▇▇▇▇▇▇▇▇▇▇▇▇▇▇▇▇▇▇▇▇▇▇▇▇ 2 [-20.0, 0.0) ┤▇▇▇▇▇▇▇▇▇▇▇▇▇▇▇▇▇▇▇▇▇▇▇▇▇▇▇▇▇▇▇▇▇▇▇▇▇ 2 [ 0.0, 20.0) ┤▇▇▇▇▇▇▇▇▇▇▇▇▇▇▇▇▇▇▇ 1 [ 20.0, 40.0) ┤▇▇▇▇▇▇▇▇▇▇▇▇▇▇▇▇▇▇▇▇▇▇▇▇▇▇▇▇▇▇▇▇▇▇▇▇▇ 2 [ 40.0, 60.0) ┤▇▇▇▇▇▇▇▇▇▇▇▇▇▇▇▇▇▇▇▇▇▇▇▇▇▇▇▇▇▇▇▇▇▇▇▇▇ 2 â”” ┘ Frequency red-data-tools-YouPlot-08da630/test/fixtures/simple-lineplot-border-barplot.txt000066400000000000000000000041531520446126500277230ustar00rootroot00000000000000 ┌ â” 50 ┤⠀⠀⠀⠀⠀⠀⠀⠀⠀⠀⠀⠀⠀⠀⠀⠀⠀⠀⠀⠀⠀⠀⠀⠀⠀⠀⠀⠀⠀⠀⠀⠀⠀⠀⠀⠀⠀⠀⠀⢸ ┤⠀⠀⠀⠀⠀⠀⠀⠀⠀⠀⠀⠀⠀⠀⠀⠀⠀⠀⠀⠀⠀⠀⠀⠀⠀⠀⠀⠀⠀⠀⠀⡄⠀⠀⠀⠀⠀⠀⠀⡸ ┤⠀⠀⠀⠀⠀⠀⠀⠀⠀⠀⠀⠀⠀⠀⠀⠀⠀⠀⠀⠀⠀⠀⠀⠀⠀⠀⠀⠀⠀⠀⢸⢇⠀⠀⠀⠀⠀⠀⠀⡇ ┤⠀⠀⠀⠀⠀⠀⠀⠀⠀⠀⠀⠀⠀⠀⠀⠀⠀⠀⠀⠀⠀⢠⢇⠀⠀⠀⠀⠀⠀⠀⡎⢸⠀⠀⠀⠀⠀⠀⢠⠃ ┤⠀⠀⠀⠀⠀⠀⠀⠀⠀⠀⠀⠀⠀⡄⠀⠀⠀⠀⠀⠀⠀⡜⢸⠀⠀⠀⠀⠀⠀⢠⠃⠈⡆⠀⠀⠀⠀⠀⢸⠀ ┤⠀⠀⠀⠀⠀⠀⠀⠀⠀⠀⠀⠀⡸⠸⡀⠀⠀⠀⠀⠀⢠⠃⠀⡇⠀⠀⠀⠀⠀⢸⠀⠀⢇⠀⠀⠀⠀⠀⡎⠀ ┤⠀⠀⠀⡠⠳⡀⠀⠀⠀⠀⠀⢠⠃⠀⢣⠀⠀⠀⠀⠀⡜⠀⠀⢱⠀⠀⠀⠀⠀⡇⠀⠀⢸⠀⠀⠀⠀⠀⡇⠀ ┤⠤⢤⠼⠤⠤⠵⡤⠤⠤⠤⢤⠧⠤⠤⠼⡤⠤⠤⠤⢤⠧⠤⠤⠬⡦⠤⠤⠤⢴⠥⠤⠤⠬⡦⠤⠤⠤⢼⠤⠤ ┤⡠⠃⠀⠀⠀⠀⠱⡀⠀⠀⡜⠀⠀⠀⠀⢱⠀⠀⠀⡸⠀⠀⠀⠀⢣⠀⠀⠀⡸⠀⠀⠀⠀⡇⠀⠀⠀⡜⠀⠀ ┤â â €â €â €â €â €â €â ±â¡€â¡°â â €â €â €â €â €â¡‡â €â¢€â ‡â €â €â €â €â ¸â¡€â €â €â¡‡â €â €â €â €â¢¸â €â €â €â¡‡â €â € ┤⠀⠀⠀⠀⠀⠀⠀⠀⠱⠃⠀⠀⠀⠀⠀⠀⠸⡀⡸⠀⠀⠀⠀⠀⠀⢇⠀⢸⠀⠀⠀⠀⠀⠘⡄⠀⢰â â €â € ┤⠀⠀⠀⠀⠀⠀⠀⠀⠀⠀⠀⠀⠀⠀⠀⠀⠀⢇⠇⠀⠀⠀⠀⠀⠀⢸⠀⡎⠀⠀⠀⠀⠀⠀⡇⠀⢸⠀⠀⠀ ┤⠀⠀⠀⠀⠀⠀⠀⠀⠀⠀⠀⠀⠀⠀⠀⠀⠀⠈⠀⠀⠀⠀⠀⠀⠀⠀⣇⠇⠀⠀⠀⠀⠀⠀⢸⠀⡇⠀⠀⠀ ┤⠀⠀⠀⠀⠀⠀⠀⠀⠀⠀⠀⠀⠀⠀⠀⠀⠀⠀⠀⠀⠀⠀⠀⠀⠀⠀⠹⠀⠀⠀⠀⠀⠀⠀⠘⣄⠇⠀⠀⠀ -50 ┤⠀⠀⠀⠀⠀⠀⠀⠀⠀⠀⠀⠀⠀⠀⠀⠀⠀⠀⠀⠀⠀⠀⠀⠀⠀⠀⠀⠀⠀⠀⠀⠀⠀⠀⠀⣿⠀⠀⠀⠀ â”” ┘ 1 10 red-data-tools-YouPlot-08da630/test/fixtures/simple-lineplot-border-corners.txt000066400000000000000000000041151520446126500277310ustar00rootroot00000000000000 ┌ â” 50 ⠀⠀⠀⠀⠀⠀⠀⠀⠀⠀⠀⠀⠀⠀⠀⠀⠀⠀⠀⠀⠀⠀⠀⠀⠀⠀⠀⠀⠀⠀⠀⠀⠀⠀⠀⠀⠀⠀⠀⢸ ⠀⠀⠀⠀⠀⠀⠀⠀⠀⠀⠀⠀⠀⠀⠀⠀⠀⠀⠀⠀⠀⠀⠀⠀⠀⠀⠀⠀⠀⠀⠀⡄⠀⠀⠀⠀⠀⠀⠀⡸ ⠀⠀⠀⠀⠀⠀⠀⠀⠀⠀⠀⠀⠀⠀⠀⠀⠀⠀⠀⠀⠀⠀⠀⠀⠀⠀⠀⠀⠀⠀⢸⢇⠀⠀⠀⠀⠀⠀⠀⡇ ⠀⠀⠀⠀⠀⠀⠀⠀⠀⠀⠀⠀⠀⠀⠀⠀⠀⠀⠀⠀⠀⢠⢇⠀⠀⠀⠀⠀⠀⠀⡎⢸⠀⠀⠀⠀⠀⠀⢠⠃ ⠀⠀⠀⠀⠀⠀⠀⠀⠀⠀⠀⠀⠀⡄⠀⠀⠀⠀⠀⠀⠀⡜⢸⠀⠀⠀⠀⠀⠀⢠⠃⠈⡆⠀⠀⠀⠀⠀⢸⠀ ⠀⠀⠀⠀⠀⠀⠀⠀⠀⠀⠀⠀⡸⠸⡀⠀⠀⠀⠀⠀⢠⠃⠀⡇⠀⠀⠀⠀⠀⢸⠀⠀⢇⠀⠀⠀⠀⠀⡎⠀ ⠀⠀⠀⡠⠳⡀⠀⠀⠀⠀⠀⢠⠃⠀⢣⠀⠀⠀⠀⠀⡜⠀⠀⢱⠀⠀⠀⠀⠀⡇⠀⠀⢸⠀⠀⠀⠀⠀⡇⠀ ⠤⢤⠼⠤⠤⠵⡤⠤⠤⠤⢤⠧⠤⠤⠼⡤⠤⠤⠤⢤⠧⠤⠤⠬⡦⠤⠤⠤⢴⠥⠤⠤⠬⡦⠤⠤⠤⢼⠤⠤ ⡠⠃⠀⠀⠀⠀⠱⡀⠀⠀⡜⠀⠀⠀⠀⢱⠀⠀⠀⡸⠀⠀⠀⠀⢣⠀⠀⠀⡸⠀⠀⠀⠀⡇⠀⠀⠀⡜⠀⠀ â â €â €â €â €â €â €â ±â¡€â¡°â â €â €â €â €â €â¡‡â €â¢€â ‡â €â €â €â €â ¸â¡€â €â €â¡‡â €â €â €â €â¢¸â €â €â €â¡‡â €â € ⠀⠀⠀⠀⠀⠀⠀⠀⠱⠃⠀⠀⠀⠀⠀⠀⠸⡀⡸⠀⠀⠀⠀⠀⠀⢇⠀⢸⠀⠀⠀⠀⠀⠘⡄⠀⢰â â €â € ⠀⠀⠀⠀⠀⠀⠀⠀⠀⠀⠀⠀⠀⠀⠀⠀⠀⢇⠇⠀⠀⠀⠀⠀⠀⢸⠀⡎⠀⠀⠀⠀⠀⠀⡇⠀⢸⠀⠀⠀ ⠀⠀⠀⠀⠀⠀⠀⠀⠀⠀⠀⠀⠀⠀⠀⠀⠀⠈⠀⠀⠀⠀⠀⠀⠀⠀⣇⠇⠀⠀⠀⠀⠀⠀⢸⠀⡇⠀⠀⠀ ⠀⠀⠀⠀⠀⠀⠀⠀⠀⠀⠀⠀⠀⠀⠀⠀⠀⠀⠀⠀⠀⠀⠀⠀⠀⠀⠹⠀⠀⠀⠀⠀⠀⠀⠘⣄⠇⠀⠀⠀ -50 ⠀⠀⠀⠀⠀⠀⠀⠀⠀⠀⠀⠀⠀⠀⠀⠀⠀⠀⠀⠀⠀⠀⠀⠀⠀⠀⠀⠀⠀⠀⠀⠀⠀⠀⠀⣿⠀⠀⠀⠀ â”” ┘ 1 10 red-data-tools-YouPlot-08da630/test/fixtures/simple-lineplot-canvas-ascii.txt000066400000000000000000000021711520446126500273440ustar00rootroot00000000000000 ┌────────────────────────────────────────┠50 │ |│ │ ., /│ │ .\ /│ │ .\ |\ .`│ │ , /\ ,`", . │ │ /|. .` . / \ | │ │ .\. .` \ / l / \ | │ │-----^r----^---r--------r--------r---|--│ │.` \. | \ / | | \ | │ │` \./ . .` |. | \ | │ │ \` |./ . . ", ,` │ │ \` \ | \ / │ │ " |` \ | │ │ / ",` │ -50 │ Y │ └────────────────────────────────────────┘ 1 10 red-data-tools-YouPlot-08da630/test/fixtures/simple-lineplot-canvas-density.txt000066400000000000000000000025611520446126500277360ustar00rootroot00000000000000 ┌────────────────────────────────────────┠50 │ ░│ │ â–‘ ░│ │ â–‘â–‘ ░│ │ â–‘â–’ â–‘â–‘ ░░│ │ â–‘ â–‘â–‘ â–‘â–‘â–‘ â–‘ │ │ â–‘â–‘ â–‘â–‘ â–‘ â–‘ â–‘ â–‘ │ │ â–‘â–’ â–‘â–‘ â–‘ â–‘ â–‘ â–‘ â–‘ â–‘ │ │░░▒░░▒░░░░░▒░░░░░░░░▒░░░░░░░░░░░░░░░░▒░░│ │░░ â–‘ â–‘ â–‘ â–‘ â–‘ â–‘ â–‘ â–‘ │ │░ â–‘ â–‘â–‘ â–‘â–‘ â–‘ â–‘ â–‘ â–‘ â–‘ │ │ â–’â–‘ â–‘ â–‘ â–‘ â–‘ â–‘â–‘ â–‘â–‘ │ │ â–‘â–‘ â–‘ â–‘ â–‘ â–‘ │ │ â–‘ â–‘â–‘ â–‘ â–‘ │ │ â–“ â–‘â–‘â–‘ │ -50 │ â–ˆ │ └────────────────────────────────────────┘ 1 10 red-data-tools-YouPlot-08da630/test/fixtures/simple-lineplot-canvas-dot.txt000066400000000000000000000021711520446126500270420ustar00rootroot00000000000000 ┌────────────────────────────────────────┠50 │ :│ │ . :│ │ :: :│ │ .: :: .'│ │ . :: :'. : │ │ :: .' : : : : │ │ .: .' : : : : : : │ │..:..:.....:..:.....:..:.....:..:....:..│ │.' : : : : : : : : │ │' : .' '. : : : : : │ │ :' : : : : '. .' │ │ :: : : : : │ │ ' :: : : │ │ : '.' │ -50 │ : │ └────────────────────────────────────────┘ 1 10 red-data-tools-YouPlot-08da630/test/fixtures/simple-lineplot-height-17.txt000066400000000000000000000050671520446126500265070ustar00rootroot00000000000000 ┌────────────────────────────────────────┠50 │⠀⠀⠀⠀⠀⠀⠀⠀⠀⠀⠀⠀⠀⠀⠀⠀⠀⠀⠀⠀⠀⠀⠀⠀⠀⠀⠀⠀⠀⠀⠀⠀⠀⠀⠀⠀⠀⠀⠀⢸│ │⠀⠀⠀⠀⠀⠀⠀⠀⠀⠀⠀⠀⠀⠀⠀⠀⠀⠀⠀⠀⠀⠀⠀⠀⠀⠀⠀⠀⠀⠀⠀⡄⠀⠀⠀⠀⠀⠀⠀⢸│ │⠀⠀⠀⠀⠀⠀⠀⠀⠀⠀⠀⠀⠀⠀⠀⠀⠀⠀⠀⠀⠀⠀⠀⠀⠀⠀⠀⠀⠀⠀⢸⡇⠀⠀⠀⠀⠀⠀⠀⡇│ │⠀⠀⠀⠀⠀⠀⠀⠀⠀⠀⠀⠀⠀⠀⠀⠀⠀⠀⠀⠀⠀⠀⡆⠀⠀⠀⠀⠀⠀⠀⡸⢸⠀⠀⠀⠀⠀⠀⠀⡇│ │⠀⠀⠀⠀⠀⠀⠀⠀⠀⠀⠀⠀⠀⠀⠀⠀⠀⠀⠀⠀⠀⢸⢸⠀⠀⠀⠀⠀⠀⠀⡇⠸⡀⠀⠀⠀⠀⠀⢸⠀│ │⠀⠀⠀⠀⠀⠀⠀⠀⠀⠀⠀⠀⢠⢣⠀⠀⠀⠀⠀⠀⠀⡇⠘⡄⠀⠀⠀⠀⠀⢰â â €â¡‡â €â €â €â €â €â¡¸â €â”‚ │⠀⠀⠀⠀⡀⠀⠀⠀⠀⠀⠀⠀⡎⠘⡄⠀⠀⠀⠀⠀⢰â â €â¢‡â €â €â €â €â €â¡¸â €â €â¢£â €â €â €â €â €â¡‡â €â”‚ │⠀⠀⢀⠜⠘⡄⠀⠀⠀⠀⠀⢸⠀⠀⢱⠀⠀⠀⠀⠀⡜⠀⠀⢸⠀⠀⠀⠀⠀⡇⠀⠀⢸⠀⠀⠀⠀⢀⠇⠀│ │⠤⢤⠮⠤⠤⠼⡤⠤⠤⠤⢤⠧⠤⠤⠬⡦⠤⠤⠤⢤⠧⠤⠤⠬⡦⠤⠤⠤⢴⠥⠤⠤⠬⡦⠤⠤⠤⢼⠤⠤│ │⡰â â €â €â €â €â ±â¡€â €â €â¡œâ €â €â €â €â¢±â €â €â €â¡¸â €â €â €â €â¢£â €â €â €â¡¸â €â €â €â €â¢‡â €â €â €â¡¸â €â €â”‚ │â â €â €â €â €â €â €â¢£â €â¢°â â €â €â €â €â ˆâ¡†â €â¢€â ‡â €â €â €â €â ¸â¡€â €â €â¡‡â €â €â €â €â¢¸â €â €â €â¡‡â €â €â”‚ │⠀⠀⠀⠀⠀⠀⠀⠀⢣⠇⠀⠀⠀⠀⠀⠀⢱⠀⢸⠀⠀⠀⠀⠀⠀⡇⠀⢰â â €â €â €â €â ˜â¡„⠀⢠⠃⠀⠀│ │⠀⠀⠀⠀⠀⠀⠀⠀⠀⠀⠀⠀⠀⠀⠀⠀⠈⡆⡇⠀⠀⠀⠀⠀⠀⢱⠀⡸⠀⠀⠀⠀⠀⠀⡇⠀⢸⠀⠀⠀│ │⠀⠀⠀⠀⠀⠀⠀⠀⠀⠀⠀⠀⠀⠀⠀⠀⠀⠸⠀⠀⠀⠀⠀⠀⠀⠘⡄⡇⠀⠀⠀⠀⠀⠀⢱⠀⡜⠀⠀⠀│ │⠀⠀⠀⠀⠀⠀⠀⠀⠀⠀⠀⠀⠀⠀⠀⠀⠀⠀⠀⠀⠀⠀⠀⠀⠀⠀⢷â â €â €â €â €â €â €â¢¸â €â¡‡â €â €â €â”‚ │⠀⠀⠀⠀⠀⠀⠀⠀⠀⠀⠀⠀⠀⠀⠀⠀⠀⠀⠀⠀⠀⠀⠀⠀⠀⠀⠘⠀⠀⠀⠀⠀⠀⠀⠀⣧⠃⠀⠀⠀│ -50 │⠀⠀⠀⠀⠀⠀⠀⠀⠀⠀⠀⠀⠀⠀⠀⠀⠀⠀⠀⠀⠀⠀⠀⠀⠀⠀⠀⠀⠀⠀⠀⠀⠀⠀⠀⢿⠀⠀⠀⠀│ └────────────────────────────────────────┘ 1 10 red-data-tools-YouPlot-08da630/test/fixtures/simple-lineplot-margin-17.txt000066400000000000000000000050451520446126500265100ustar00rootroot00000000000000 ┌────────────────────────────────────────┠50 │⠀⠀⠀⠀⠀⠀⠀⠀⠀⠀⠀⠀⠀⠀⠀⠀⠀⠀⠀⠀⠀⠀⠀⠀⠀⠀⠀⠀⠀⠀⠀⠀⠀⠀⠀⠀⠀⠀⠀⢸│ │⠀⠀⠀⠀⠀⠀⠀⠀⠀⠀⠀⠀⠀⠀⠀⠀⠀⠀⠀⠀⠀⠀⠀⠀⠀⠀⠀⠀⠀⠀⠀⡄⠀⠀⠀⠀⠀⠀⠀⡸│ │⠀⠀⠀⠀⠀⠀⠀⠀⠀⠀⠀⠀⠀⠀⠀⠀⠀⠀⠀⠀⠀⠀⠀⠀⠀⠀⠀⠀⠀⠀⢸⢇⠀⠀⠀⠀⠀⠀⠀⡇│ │⠀⠀⠀⠀⠀⠀⠀⠀⠀⠀⠀⠀⠀⠀⠀⠀⠀⠀⠀⠀⠀⢠⢇⠀⠀⠀⠀⠀⠀⠀⡎⢸⠀⠀⠀⠀⠀⠀⢠⠃│ │⠀⠀⠀⠀⠀⠀⠀⠀⠀⠀⠀⠀⠀⡄⠀⠀⠀⠀⠀⠀⠀⡜⢸⠀⠀⠀⠀⠀⠀⢠⠃⠈⡆⠀⠀⠀⠀⠀⢸⠀│ │⠀⠀⠀⠀⠀⠀⠀⠀⠀⠀⠀⠀⡸⠸⡀⠀⠀⠀⠀⠀⢠⠃⠀⡇⠀⠀⠀⠀⠀⢸⠀⠀⢇⠀⠀⠀⠀⠀⡎⠀│ │⠀⠀⠀⡠⠳⡀⠀⠀⠀⠀⠀⢠⠃⠀⢣⠀⠀⠀⠀⠀⡜⠀⠀⢱⠀⠀⠀⠀⠀⡇⠀⠀⢸⠀⠀⠀⠀⠀⡇⠀│ │⠤⢤⠼⠤⠤⠵⡤⠤⠤⠤⢤⠧⠤⠤⠼⡤⠤⠤⠤⢤⠧⠤⠤⠬⡦⠤⠤⠤⢴⠥⠤⠤⠬⡦⠤⠤⠤⢼⠤⠤│ │⡠⠃⠀⠀⠀⠀⠱⡀⠀⠀⡜⠀⠀⠀⠀⢱⠀⠀⠀⡸⠀⠀⠀⠀⢣⠀⠀⠀⡸⠀⠀⠀⠀⡇⠀⠀⠀⡜⠀⠀│ │â â €â €â €â €â €â €â ±â¡€â¡°â â €â €â €â €â €â¡‡â €â¢€â ‡â €â €â €â €â ¸â¡€â €â €â¡‡â €â €â €â €â¢¸â €â €â €â¡‡â €â €â”‚ │⠀⠀⠀⠀⠀⠀⠀⠀⠱⠃⠀⠀⠀⠀⠀⠀⠸⡀⡸⠀⠀⠀⠀⠀⠀⢇⠀⢸⠀⠀⠀⠀⠀⠘⡄⠀⢰â â €â €â”‚ │⠀⠀⠀⠀⠀⠀⠀⠀⠀⠀⠀⠀⠀⠀⠀⠀⠀⢇⠇⠀⠀⠀⠀⠀⠀⢸⠀⡎⠀⠀⠀⠀⠀⠀⡇⠀⢸⠀⠀⠀│ │⠀⠀⠀⠀⠀⠀⠀⠀⠀⠀⠀⠀⠀⠀⠀⠀⠀⠈⠀⠀⠀⠀⠀⠀⠀⠀⣇⠇⠀⠀⠀⠀⠀⠀⢸⠀⡇⠀⠀⠀│ │⠀⠀⠀⠀⠀⠀⠀⠀⠀⠀⠀⠀⠀⠀⠀⠀⠀⠀⠀⠀⠀⠀⠀⠀⠀⠀⠹⠀⠀⠀⠀⠀⠀⠀⠘⣄⠇⠀⠀⠀│ -50 │⠀⠀⠀⠀⠀⠀⠀⠀⠀⠀⠀⠀⠀⠀⠀⠀⠀⠀⠀⠀⠀⠀⠀⠀⠀⠀⠀⠀⠀⠀⠀⠀⠀⠀⠀⣿⠀⠀⠀⠀│ └────────────────────────────────────────┘ 1 10 red-data-tools-YouPlot-08da630/test/fixtures/simple-lineplot-no-grid.txt000066400000000000000000000044511520446126500263450ustar00rootroot00000000000000 ┌────────────────────────────────────────┠50 │⠀⠀⠀⠀⠀⠀⠀⠀⠀⠀⠀⠀⠀⠀⠀⠀⠀⠀⠀⠀⠀⠀⠀⠀⠀⠀⠀⠀⠀⠀⠀⠀⠀⠀⠀⠀⠀⠀⠀⢸│ │⠀⠀⠀⠀⠀⠀⠀⠀⠀⠀⠀⠀⠀⠀⠀⠀⠀⠀⠀⠀⠀⠀⠀⠀⠀⠀⠀⠀⠀⠀⠀⡄⠀⠀⠀⠀⠀⠀⠀⡸│ │⠀⠀⠀⠀⠀⠀⠀⠀⠀⠀⠀⠀⠀⠀⠀⠀⠀⠀⠀⠀⠀⠀⠀⠀⠀⠀⠀⠀⠀⠀⢸⢇⠀⠀⠀⠀⠀⠀⠀⡇│ │⠀⠀⠀⠀⠀⠀⠀⠀⠀⠀⠀⠀⠀⠀⠀⠀⠀⠀⠀⠀⠀⢠⢇⠀⠀⠀⠀⠀⠀⠀⡎⢸⠀⠀⠀⠀⠀⠀⢠⠃│ │⠀⠀⠀⠀⠀⠀⠀⠀⠀⠀⠀⠀⠀⡄⠀⠀⠀⠀⠀⠀⠀⡜⢸⠀⠀⠀⠀⠀⠀⢠⠃⠈⡆⠀⠀⠀⠀⠀⢸⠀│ │⠀⠀⠀⠀⠀⠀⠀⠀⠀⠀⠀⠀⡸⠸⡀⠀⠀⠀⠀⠀⢠⠃⠀⡇⠀⠀⠀⠀⠀⢸⠀⠀⢇⠀⠀⠀⠀⠀⡎⠀│ │⠀⠀⠀⡠⠳⡀⠀⠀⠀⠀⠀⢠⠃⠀⢣⠀⠀⠀⠀⠀⡜⠀⠀⢱⠀⠀⠀⠀⠀⡇⠀⠀⢸⠀⠀⠀⠀⠀⡇⠀│ │⠀⢀⠜⠀⠀⠱⡀⠀⠀⠀⢀⠇⠀⠀⠘⡄⠀⠀⠀⢠⠃⠀⠀⠈⡆⠀⠀⠀⢰â â €â €â ˆâ¡†â €â €â €â¢¸â €â €â”‚ │⡠⠃⠀⠀⠀⠀⠱⡀⠀⠀⡜⠀⠀⠀⠀⢱⠀⠀⠀⡸⠀⠀⠀⠀⢣⠀⠀⠀⡸⠀⠀⠀⠀⡇⠀⠀⠀⡜⠀⠀│ │â â €â €â €â €â €â €â ±â¡€â¡°â â €â €â €â €â €â¡‡â €â¢€â ‡â €â €â €â €â ¸â¡€â €â €â¡‡â €â €â €â €â¢¸â €â €â €â¡‡â €â €â”‚ │⠀⠀⠀⠀⠀⠀⠀⠀⠱⠃⠀⠀⠀⠀⠀⠀⠸⡀⡸⠀⠀⠀⠀⠀⠀⢇⠀⢸⠀⠀⠀⠀⠀⠘⡄⠀⢰â â €â €â”‚ │⠀⠀⠀⠀⠀⠀⠀⠀⠀⠀⠀⠀⠀⠀⠀⠀⠀⢇⠇⠀⠀⠀⠀⠀⠀⢸⠀⡎⠀⠀⠀⠀⠀⠀⡇⠀⢸⠀⠀⠀│ │⠀⠀⠀⠀⠀⠀⠀⠀⠀⠀⠀⠀⠀⠀⠀⠀⠀⠈⠀⠀⠀⠀⠀⠀⠀⠀⣇⠇⠀⠀⠀⠀⠀⠀⢸⠀⡇⠀⠀⠀│ │⠀⠀⠀⠀⠀⠀⠀⠀⠀⠀⠀⠀⠀⠀⠀⠀⠀⠀⠀⠀⠀⠀⠀⠀⠀⠀⠹⠀⠀⠀⠀⠀⠀⠀⠘⣄⠇⠀⠀⠀│ -50 │⠀⠀⠀⠀⠀⠀⠀⠀⠀⠀⠀⠀⠀⠀⠀⠀⠀⠀⠀⠀⠀⠀⠀⠀⠀⠀⠀⠀⠀⠀⠀⠀⠀⠀⠀⣿⠀⠀⠀⠀│ └────────────────────────────────────────┘ 1 10 red-data-tools-YouPlot-08da630/test/fixtures/simple-lineplot-padding-17.txt000066400000000000000000000055311520446126500266410ustar00rootroot00000000000000 ┌────────────────────────────────────────┠50 │⠀⠀⠀⠀⠀⠀⠀⠀⠀⠀⠀⠀⠀⠀⠀⠀⠀⠀⠀⠀⠀⠀⠀⠀⠀⠀⠀⠀⠀⠀⠀⠀⠀⠀⠀⠀⠀⠀⠀⢸│ │⠀⠀⠀⠀⠀⠀⠀⠀⠀⠀⠀⠀⠀⠀⠀⠀⠀⠀⠀⠀⠀⠀⠀⠀⠀⠀⠀⠀⠀⠀⠀⡄⠀⠀⠀⠀⠀⠀⠀⡸│ │⠀⠀⠀⠀⠀⠀⠀⠀⠀⠀⠀⠀⠀⠀⠀⠀⠀⠀⠀⠀⠀⠀⠀⠀⠀⠀⠀⠀⠀⠀⢸⢇⠀⠀⠀⠀⠀⠀⠀⡇│ │⠀⠀⠀⠀⠀⠀⠀⠀⠀⠀⠀⠀⠀⠀⠀⠀⠀⠀⠀⠀⠀⢠⢇⠀⠀⠀⠀⠀⠀⠀⡎⢸⠀⠀⠀⠀⠀⠀⢠⠃│ │⠀⠀⠀⠀⠀⠀⠀⠀⠀⠀⠀⠀⠀⡄⠀⠀⠀⠀⠀⠀⠀⡜⢸⠀⠀⠀⠀⠀⠀⢠⠃⠈⡆⠀⠀⠀⠀⠀⢸⠀│ │⠀⠀⠀⠀⠀⠀⠀⠀⠀⠀⠀⠀⡸⠸⡀⠀⠀⠀⠀⠀⢠⠃⠀⡇⠀⠀⠀⠀⠀⢸⠀⠀⢇⠀⠀⠀⠀⠀⡎⠀│ │⠀⠀⠀⡠⠳⡀⠀⠀⠀⠀⠀⢠⠃⠀⢣⠀⠀⠀⠀⠀⡜⠀⠀⢱⠀⠀⠀⠀⠀⡇⠀⠀⢸⠀⠀⠀⠀⠀⡇⠀│ │⠤⢤⠼⠤⠤⠵⡤⠤⠤⠤⢤⠧⠤⠤⠼⡤⠤⠤⠤⢤⠧⠤⠤⠬⡦⠤⠤⠤⢴⠥⠤⠤⠬⡦⠤⠤⠤⢼⠤⠤│ │⡠⠃⠀⠀⠀⠀⠱⡀⠀⠀⡜⠀⠀⠀⠀⢱⠀⠀⠀⡸⠀⠀⠀⠀⢣⠀⠀⠀⡸⠀⠀⠀⠀⡇⠀⠀⠀⡜⠀⠀│ │â â €â €â €â €â €â €â ±â¡€â¡°â â €â €â €â €â €â¡‡â €â¢€â ‡â €â €â €â €â ¸â¡€â €â €â¡‡â €â €â €â €â¢¸â €â €â €â¡‡â €â €â”‚ │⠀⠀⠀⠀⠀⠀⠀⠀⠱⠃⠀⠀⠀⠀⠀⠀⠸⡀⡸⠀⠀⠀⠀⠀⠀⢇⠀⢸⠀⠀⠀⠀⠀⠘⡄⠀⢰â â €â €â”‚ │⠀⠀⠀⠀⠀⠀⠀⠀⠀⠀⠀⠀⠀⠀⠀⠀⠀⢇⠇⠀⠀⠀⠀⠀⠀⢸⠀⡎⠀⠀⠀⠀⠀⠀⡇⠀⢸⠀⠀⠀│ │⠀⠀⠀⠀⠀⠀⠀⠀⠀⠀⠀⠀⠀⠀⠀⠀⠀⠈⠀⠀⠀⠀⠀⠀⠀⠀⣇⠇⠀⠀⠀⠀⠀⠀⢸⠀⡇⠀⠀⠀│ │⠀⠀⠀⠀⠀⠀⠀⠀⠀⠀⠀⠀⠀⠀⠀⠀⠀⠀⠀⠀⠀⠀⠀⠀⠀⠀⠹⠀⠀⠀⠀⠀⠀⠀⠘⣄⠇⠀⠀⠀│ -50 │⠀⠀⠀⠀⠀⠀⠀⠀⠀⠀⠀⠀⠀⠀⠀⠀⠀⠀⠀⠀⠀⠀⠀⠀⠀⠀⠀⠀⠀⠀⠀⠀⠀⠀⠀⣿⠀⠀⠀⠀│ └────────────────────────────────────────┘ 1 10 red-data-tools-YouPlot-08da630/test/fixtures/simple-lineplot-width-17.txt000066400000000000000000000021751520446126500263530ustar00rootroot00000000000000 ┌─────────────────┠50 │⠀⠀⠀⠀⠀⠀⠀⠀⠀⠀⠀⠀⠀⠀⠀⠀⢸│ │⠀⠀⠀⠀⠀⠀⠀⠀⠀⠀⠀⠀⠀⡄⠀⠀⢸│ │⠀⠀⠀⠀⠀⠀⠀⠀⠀⠀⠀⠀⠀⡇⠀⠀⢸│ │⠀⠀⠀⠀⠀⠀⠀⠀⠀⣧⠀⠀⢸⢣⠀⠀⢸│ │⠀⠀⠀⠀⠀⢠⠀⠀⠀⣿⠀⠀⢸⢸⠀⠀⡇│ │⠀⠀⠀⠀⠀⣾⠀⠀⢰⢹⠀⠀⢸⢸⠀⠀⡇│ │⠀⡸⡄⠀⢀⠇⡇⠀⢸⠈⡆⠀⡎⢸⠀⠀⡇│ │⢤⠧⢧⠤⢼⠤⡧⠤⡼⠤⡧⠤⡧⠬⡦⠤⡧│ │⡎⠀⠸⡀⡎⠀⢸⠀⡇⠀⡇⠀⡇⠀⡇⢸⠀│ │â â €â €â¡‡â¡‡â €â¢¸â €â¡‡â €â¢¸â¢ â ƒâ €â¡‡â¢¸â €â”‚ │⠀⠀⠀⠸⠀⠀⠀⣿⠀⠀⢸⢸⠀⠀⢇⢸⠀│ │⠀⠀⠀⠀⠀⠀⠀⣿⠀⠀⠸⣸⠀⠀⢸⢸⠀│ │⠀⠀⠀⠀⠀⠀⠀⠈⠀⠀⠀⡟⠀⠀⢸⡇⠀│ │⠀⠀⠀⠀⠀⠀⠀⠀⠀⠀⠀⠇⠀⠀⢸⡇⠀│ -50 │⠀⠀⠀⠀⠀⠀⠀⠀⠀⠀⠀⠀⠀⠀⠈⡇⠀│ └─────────────────┘ 1 10 red-data-tools-YouPlot-08da630/test/fixtures/simple-lineplot-xlabel.txt000066400000000000000000000045111520446126500262520ustar00rootroot00000000000000 ┌────────────────────────────────────────┠50 │⠀⠀⠀⠀⠀⠀⠀⠀⠀⠀⠀⠀⠀⠀⠀⠀⠀⠀⠀⠀⠀⠀⠀⠀⠀⠀⠀⠀⠀⠀⠀⠀⠀⠀⠀⠀⠀⠀⠀⢸│ │⠀⠀⠀⠀⠀⠀⠀⠀⠀⠀⠀⠀⠀⠀⠀⠀⠀⠀⠀⠀⠀⠀⠀⠀⠀⠀⠀⠀⠀⠀⠀⡄⠀⠀⠀⠀⠀⠀⠀⡸│ │⠀⠀⠀⠀⠀⠀⠀⠀⠀⠀⠀⠀⠀⠀⠀⠀⠀⠀⠀⠀⠀⠀⠀⠀⠀⠀⠀⠀⠀⠀⢸⢇⠀⠀⠀⠀⠀⠀⠀⡇│ │⠀⠀⠀⠀⠀⠀⠀⠀⠀⠀⠀⠀⠀⠀⠀⠀⠀⠀⠀⠀⠀⢠⢇⠀⠀⠀⠀⠀⠀⠀⡎⢸⠀⠀⠀⠀⠀⠀⢠⠃│ │⠀⠀⠀⠀⠀⠀⠀⠀⠀⠀⠀⠀⠀⡄⠀⠀⠀⠀⠀⠀⠀⡜⢸⠀⠀⠀⠀⠀⠀⢠⠃⠈⡆⠀⠀⠀⠀⠀⢸⠀│ │⠀⠀⠀⠀⠀⠀⠀⠀⠀⠀⠀⠀⡸⠸⡀⠀⠀⠀⠀⠀⢠⠃⠀⡇⠀⠀⠀⠀⠀⢸⠀⠀⢇⠀⠀⠀⠀⠀⡎⠀│ │⠀⠀⠀⡠⠳⡀⠀⠀⠀⠀⠀⢠⠃⠀⢣⠀⠀⠀⠀⠀⡜⠀⠀⢱⠀⠀⠀⠀⠀⡇⠀⠀⢸⠀⠀⠀⠀⠀⡇⠀│ │⠤⢤⠼⠤⠤⠵⡤⠤⠤⠤⢤⠧⠤⠤⠼⡤⠤⠤⠤⢤⠧⠤⠤⠬⡦⠤⠤⠤⢴⠥⠤⠤⠬⡦⠤⠤⠤⢼⠤⠤│ │⡠⠃⠀⠀⠀⠀⠱⡀⠀⠀⡜⠀⠀⠀⠀⢱⠀⠀⠀⡸⠀⠀⠀⠀⢣⠀⠀⠀⡸⠀⠀⠀⠀⡇⠀⠀⠀⡜⠀⠀│ │â â €â €â €â €â €â €â ±â¡€â¡°â â €â €â €â €â €â¡‡â €â¢€â ‡â €â €â €â €â ¸â¡€â €â €â¡‡â €â €â €â €â¢¸â €â €â €â¡‡â €â €â”‚ │⠀⠀⠀⠀⠀⠀⠀⠀⠱⠃⠀⠀⠀⠀⠀⠀⠸⡀⡸⠀⠀⠀⠀⠀⠀⢇⠀⢸⠀⠀⠀⠀⠀⠘⡄⠀⢰â â €â €â”‚ │⠀⠀⠀⠀⠀⠀⠀⠀⠀⠀⠀⠀⠀⠀⠀⠀⠀⢇⠇⠀⠀⠀⠀⠀⠀⢸⠀⡎⠀⠀⠀⠀⠀⠀⡇⠀⢸⠀⠀⠀│ │⠀⠀⠀⠀⠀⠀⠀⠀⠀⠀⠀⠀⠀⠀⠀⠀⠀⠈⠀⠀⠀⠀⠀⠀⠀⠀⣇⠇⠀⠀⠀⠀⠀⠀⢸⠀⡇⠀⠀⠀│ │⠀⠀⠀⠀⠀⠀⠀⠀⠀⠀⠀⠀⠀⠀⠀⠀⠀⠀⠀⠀⠀⠀⠀⠀⠀⠀⠹⠀⠀⠀⠀⠀⠀⠀⠘⣄⠇⠀⠀⠀│ -50 │⠀⠀⠀⠀⠀⠀⠀⠀⠀⠀⠀⠀⠀⠀⠀⠀⠀⠀⠀⠀⠀⠀⠀⠀⠀⠀⠀⠀⠀⠀⠀⠀⠀⠀⠀⣿⠀⠀⠀⠀│ └────────────────────────────────────────┘ 1 10 X-LABEL red-data-tools-YouPlot-08da630/test/fixtures/simple-lineplot-xlim--1-5-ylim--25-50.txt000066400000000000000000000044511520446126500300270ustar00rootroot00000000000000 ┌────────────────────────────────────────┠50 │⠀⠀⠀⠀⠀⠀⢸⠀⠀⠀⠀⠀⠀⠀⠀⠀⠀⠀⠀⠀⠀⠀⠀⠀⠀⠀⠀⠀⠀⠀⠀⠀⠀⠀⠀⠀⠀⠀⠀⠀│ │⠀⠀⠀⠀⠀⠀⢸⠀⠀⠀⠀⠀⠀⠀⠀⠀⠀⠀⠀⠀⠀⠀⠀⠀⠀⠀⠀⠀⠀⠀⠀⠀⠀⠀⠀⠀⠀⠀⠀⠀│ │⠀⠀⠀⠀⠀⠀⢸⠀⠀⠀⠀⠀⠀⠀⠀⠀⠀⠀⠀⠀⠀⠀⠀⠀⠀⠀⠀⠀⠀⠀⠀⠀⠀⠀⠀⠀⠀⠀⠀⠀│ │⠀⠀⠀⠀⠀⠀⢸⠀⠀⠀⠀⠀⠀⠀⠀⠀⠀⠀⠀⠀⠀⠀⠀⠀⠀⠀⠀⠀⠀⠀⠀⠀⠀⠀⠀⠀⠀⠀⠀⠀│ │⠀⠀⠀⠀⠀⠀⢸⠀⠀⠀⠀⠀⠀⠀⠀⠀⠀⠀⠀⠀⠀⠀⠀⠀⠀⠀⠀⠀⠀⠀⠀⠀⠀⠀⠀⠀⠀⠀⠀⠀│ │⠀⠀⠀⠀⠀⠀⢸⠀⠀⠀⠀⠀⠀⠀⠀⠀⠀⠀⠀⠀⠀⠀⠀⠀⠀⠀⠀⠀⠀⠀⠀⠀⠀⠀⠀⠀⠀⠀⠀⠀│ │⠀⠀⠀⠀⠀⠀⢸⠀⠀⠀⠀⠀⠀⠀⠀⠀⠀⠀⠀⠀⠀⠀⠀⠀⠀⠀⠀⠀⠀⠀⠀⠀⢠⢳⠀⠀⠀⠀⠀⠀│ │⠀⠀⠀⠀⠀⠀⢸⠀⠀⠀⠀⠀⠀⠀⠀⠀⠀⠀⠀⠀⠀⠀⠀⠀⠀⠀⠀⠀⠀⠀⠀⢀⠇⠈⡆⠀⠀⠀⠀⠀│ │⠀⠀⠀⠀⠀⠀⢸⠀⠀⠀⠀⠀⠀⠀⠀⠀⠀⠀⢀⠔⢣⠀⠀⠀⠀⠀⠀⠀⠀⠀⠀⡎⠀⠀⠸⡀⠀⠀⠀⠀│ │⠀⠀⠀⠀⠀⠀⢸⠀⠀⠀⠀⠀⠀⠀⠀⠀⠀⡰â â €â €â¢£â €â €â €â €â €â €â €â €â¡œâ €â €â €â €â¢£â €â €â €â €â”‚ │⠉⠉⠉⠉⠉⠉⢹⠉⠉⠉⠉⠉⠉⠉⠉⡩⠋⠉⠉⠉⠉⠉⠹⡉⠉⠉⠉⠉⠉⡹⠉⠉⠉⠉⠉⠉â¡â ‰â ‰â ‰â”‚ │⠀⠀⠀⠀⠀⠀⢸⠀⠀⠀⠀⠀⠀⢀⠜⠀⠀⠀⠀⠀⠀⠀⠀⠱⡀⠀⠀⠀⢰â â €â €â €â €â €â €â ¸â¡€â €â €â”‚ │⠀⠀⠀⠀⠀⠀⢸⠀⠀⠀⠀⠀⠀â â €â €â €â €â €â €â €â €â €â €â ‘⡄⠀⢠⠃⠀⠀⠀⠀⠀⠀⠀⠀⢣⠀⠀│ │⠀⠀⠀⠀⠀⠀⢸⠀⠀⠀⠀⠀⠀⠀⠀⠀⠀⠀⠀⠀⠀⠀⠀⠀⠀⠘⣄⠇⠀⠀⠀⠀⠀⠀⠀⠀⠀⠈⡆⠀│ -25 │⠀⠀⠀⠀⠀⠀⢸⠀⠀⠀⠀⠀⠀⠀⠀⠀⠀⠀⠀⠀⠀⠀⠀⠀⠀⠀⠈⠀⠀⠀⠀⠀⠀⠀⠀⠀⠀⠀⠸⡀│ └────────────────────────────────────────┘ -1 5 red-data-tools-YouPlot-08da630/test/fixtures/simple-lineplot-xlim--1-5.txt000066400000000000000000000044511520446126500263340ustar00rootroot00000000000000 ┌────────────────────────────────────────┠50 │⠀⠀⠀⠀⠀⠀⢸⠀⠀⠀⠀⠀⠀⠀⠀⠀⠀⠀⠀⠀⠀⠀⠀⠀⠀⠀⠀⠀⠀⠀⠀⠀⠀⠀⠀⠀⠀⠀⠀⠀│ │⠀⠀⠀⠀⠀⠀⢸⠀⠀⠀⠀⠀⠀⠀⠀⠀⠀⠀⠀⠀⠀⠀⠀⠀⠀⠀⠀⠀⠀⠀⠀⠀⠀⠀⠀⠀⠀⠀⠀⠀│ │⠀⠀⠀⠀⠀⠀⢸⠀⠀⠀⠀⠀⠀⠀⠀⠀⠀⠀⠀⠀⠀⠀⠀⠀⠀⠀⠀⠀⠀⠀⠀⠀⠀⠀⠀⠀⠀⠀⠀⠀│ │⠀⠀⠀⠀⠀⠀⢸⠀⠀⠀⠀⠀⠀⠀⠀⠀⠀⠀⠀⠀⠀⠀⠀⠀⠀⠀⠀⠀⠀⠀⠀⠀⠀⠀⠀⠀⠀⠀⠀⠀│ │⠀⠀⠀⠀⠀⠀⢸⠀⠀⠀⠀⠀⠀⠀⠀⠀⠀⠀⠀⠀⠀⠀⠀⠀⠀⠀⠀⠀⠀⠀⠀⠀⠀⣄⠀⠀⠀⠀⠀⠀│ │⠀⠀⠀⠀⠀⠀⢸⠀⠀⠀⠀⠀⠀⠀⠀⠀⠀⠀⠀⠀⠀⠀⠀⠀⠀⠀⠀⠀⠀⠀⠀⢀⠜⠈⡆⠀⠀⠀⠀⠀│ │⠀⠀⠀⠀⠀⠀⢸⠀⠀⠀⠀⠀⠀⠀⠀⠀⠀⢀⡠⠊⠣⡀⠀⠀⠀⠀⠀⠀⠀⠀⢀⠎⠀⠀⠘⡄⠀⠀⠀⠀│ │⠤⠤⠤⠤⠤⠤⢼⠤⠤⠤⠤⠤⠤⠤⠤⢤⠴⠥⠤⠤⠤⠵⢤⠤⠤⠤⠤⠤⠤⢤⠮⠤⠤⠤⠤⠼⡤⠤⠤⠤│ │⠀⠀⠀⠀⠀⠀⢸⠀⠀⠀⠀⠀⠀⢀⠔â â €â €â €â €â €â €â ˆâ ¢â¡€â €â €â €â¢ â ƒâ €â €â €â €â €â €â ±â¡€â €â €â”‚ │⠀⠀⠀⠀⠀⠀⢸⠀⠀⠀⠀⠀⠀â â €â €â €â €â €â €â €â €â €â €â ‘⢄⠀⢠⠃⠀⠀⠀⠀⠀⠀⠀⠀⢱⠀⠀│ │⠀⠀⠀⠀⠀⠀⢸⠀⠀⠀⠀⠀⠀⠀⠀⠀⠀⠀⠀⠀⠀⠀⠀⠀⠀⠈⠲â â €â €â €â €â €â €â €â €â €â €â¢£â €â”‚ │⠀⠀⠀⠀⠀⠀⢸⠀⠀⠀⠀⠀⠀⠀⠀⠀⠀⠀⠀⠀⠀⠀⠀⠀⠀⠀⠀⠀⠀⠀⠀⠀⠀⠀⠀⠀⠀⠀⠀⢣│ │⠀⠀⠀⠀⠀⠀⢸⠀⠀⠀⠀⠀⠀⠀⠀⠀⠀⠀⠀⠀⠀⠀⠀⠀⠀⠀⠀⠀⠀⠀⠀⠀⠀⠀⠀⠀⠀⠀⠀⠈│ │⠀⠀⠀⠀⠀⠀⢸⠀⠀⠀⠀⠀⠀⠀⠀⠀⠀⠀⠀⠀⠀⠀⠀⠀⠀⠀⠀⠀⠀⠀⠀⠀⠀⠀⠀⠀⠀⠀⠀⠀│ -50 │⠀⠀⠀⠀⠀⠀⢸⠀⠀⠀⠀⠀⠀⠀⠀⠀⠀⠀⠀⠀⠀⠀⠀⠀⠀⠀⠀⠀⠀⠀⠀⠀⠀⠀⠀⠀⠀⠀⠀⠀│ └────────────────────────────────────────┘ -1 5 red-data-tools-YouPlot-08da630/test/fixtures/simple-lineplot-ylabel.txt000066400000000000000000000046711520446126500262620ustar00rootroot00000000000000 ┌────────────────────────────────────────┠50 │⠀⠀⠀⠀⠀⠀⠀⠀⠀⠀⠀⠀⠀⠀⠀⠀⠀⠀⠀⠀⠀⠀⠀⠀⠀⠀⠀⠀⠀⠀⠀⠀⠀⠀⠀⠀⠀⠀⠀⢸│ │⠀⠀⠀⠀⠀⠀⠀⠀⠀⠀⠀⠀⠀⠀⠀⠀⠀⠀⠀⠀⠀⠀⠀⠀⠀⠀⠀⠀⠀⠀⠀⡄⠀⠀⠀⠀⠀⠀⠀⡸│ │⠀⠀⠀⠀⠀⠀⠀⠀⠀⠀⠀⠀⠀⠀⠀⠀⠀⠀⠀⠀⠀⠀⠀⠀⠀⠀⠀⠀⠀⠀⢸⢇⠀⠀⠀⠀⠀⠀⠀⡇│ │⠀⠀⠀⠀⠀⠀⠀⠀⠀⠀⠀⠀⠀⠀⠀⠀⠀⠀⠀⠀⠀⢠⢇⠀⠀⠀⠀⠀⠀⠀⡎⢸⠀⠀⠀⠀⠀⠀⢠⠃│ │⠀⠀⠀⠀⠀⠀⠀⠀⠀⠀⠀⠀⠀⡄⠀⠀⠀⠀⠀⠀⠀⡜⢸⠀⠀⠀⠀⠀⠀⢠⠃⠈⡆⠀⠀⠀⠀⠀⢸⠀│ │⠀⠀⠀⠀⠀⠀⠀⠀⠀⠀⠀⠀⡸⠸⡀⠀⠀⠀⠀⠀⢠⠃⠀⡇⠀⠀⠀⠀⠀⢸⠀⠀⢇⠀⠀⠀⠀⠀⡎⠀│ │⠀⠀⠀⡠⠳⡀⠀⠀⠀⠀⠀⢠⠃⠀⢣⠀⠀⠀⠀⠀⡜⠀⠀⢱⠀⠀⠀⠀⠀⡇⠀⠀⢸⠀⠀⠀⠀⠀⡇⠀│ Y-LABEL │⠤⢤⠼⠤⠤⠵⡤⠤⠤⠤⢤⠧⠤⠤⠼⡤⠤⠤⠤⢤⠧⠤⠤⠬⡦⠤⠤⠤⢴⠥⠤⠤⠬⡦⠤⠤⠤⢼⠤⠤│ │⡠⠃⠀⠀⠀⠀⠱⡀⠀⠀⡜⠀⠀⠀⠀⢱⠀⠀⠀⡸⠀⠀⠀⠀⢣⠀⠀⠀⡸⠀⠀⠀⠀⡇⠀⠀⠀⡜⠀⠀│ │â â €â €â €â €â €â €â ±â¡€â¡°â â €â €â €â €â €â¡‡â €â¢€â ‡â €â €â €â €â ¸â¡€â €â €â¡‡â €â €â €â €â¢¸â €â €â €â¡‡â €â €â”‚ │⠀⠀⠀⠀⠀⠀⠀⠀⠱⠃⠀⠀⠀⠀⠀⠀⠸⡀⡸⠀⠀⠀⠀⠀⠀⢇⠀⢸⠀⠀⠀⠀⠀⠘⡄⠀⢰â â €â €â”‚ │⠀⠀⠀⠀⠀⠀⠀⠀⠀⠀⠀⠀⠀⠀⠀⠀⠀⢇⠇⠀⠀⠀⠀⠀⠀⢸⠀⡎⠀⠀⠀⠀⠀⠀⡇⠀⢸⠀⠀⠀│ │⠀⠀⠀⠀⠀⠀⠀⠀⠀⠀⠀⠀⠀⠀⠀⠀⠀⠈⠀⠀⠀⠀⠀⠀⠀⠀⣇⠇⠀⠀⠀⠀⠀⠀⢸⠀⡇⠀⠀⠀│ │⠀⠀⠀⠀⠀⠀⠀⠀⠀⠀⠀⠀⠀⠀⠀⠀⠀⠀⠀⠀⠀⠀⠀⠀⠀⠀⠹⠀⠀⠀⠀⠀⠀⠀⠘⣄⠇⠀⠀⠀│ -50 │⠀⠀⠀⠀⠀⠀⠀⠀⠀⠀⠀⠀⠀⠀⠀⠀⠀⠀⠀⠀⠀⠀⠀⠀⠀⠀⠀⠀⠀⠀⠀⠀⠀⠀⠀⣿⠀⠀⠀⠀│ └────────────────────────────────────────┘ 1 10 red-data-tools-YouPlot-08da630/test/fixtures/simple-lineplot-ylim--25-50.txt000066400000000000000000000044511520446126500265030ustar00rootroot00000000000000 ┌────────────────────────────────────────┠50 │⠀⠀⠀⠀⠀⠀⠀⠀⠀⠀⠀⠀⠀⠀⠀⠀⠀⠀⠀⠀⠀⠀⠀⠀⠀⠀⠀⠀⠀⠀⠀⠀⠀⠀⠀⠀⠀⠀⠀⢸│ │⠀⠀⠀⠀⠀⠀⠀⠀⠀⠀⠀⠀⠀⠀⠀⠀⠀⠀⠀⠀⠀⠀⠀⠀⠀⠀⠀⠀⠀⠀⠀⠀⠀⠀⠀⠀⠀⠀⠀⢸│ │⠀⠀⠀⠀⠀⠀⠀⠀⠀⠀⠀⠀⠀⠀⠀⠀⠀⠀⠀⠀⠀⠀⠀⠀⠀⠀⠀⠀⠀⠀⢠⡇⠀⠀⠀⠀⠀⠀⠀⡜│ │⠀⠀⠀⠀⠀⠀⠀⠀⠀⠀⠀⠀⠀⠀⠀⠀⠀⠀⠀⠀⠀⠀⠀⠀⠀⠀⠀⠀⠀⠀⢸⢇⠀⠀⠀⠀⠀⠀⠀⡇│ │⠀⠀⠀⠀⠀⠀⠀⠀⠀⠀⠀⠀⠀⠀⠀⠀⠀⠀⠀⠀⠀⢀⡇⠀⠀⠀⠀⠀⠀⠀⡎⢸⠀⠀⠀⠀⠀⠀⢀⠇│ │⠀⠀⠀⠀⠀⠀⠀⠀⠀⠀⠀⠀⠀⠀⠀⠀⠀⠀⠀⠀⠀⢸⢸⠀⠀⠀⠀⠀⠀⠀⡇⠸⡀⠀⠀⠀⠀⠀⢸⠀│ │⠀⠀⠀⠀⠀⠀⠀⠀⠀⠀⠀⠀⢀⢧⠀⠀⠀⠀⠀⠀⠀⡇⠘⡄⠀⠀⠀⠀⠀⢸⠀⠀⡇⠀⠀⠀⠀⠀⢸⠀│ │⠀⠀⠀⠀⠀⠀⠀⠀⠀⠀⠀⠀⡸⠸⡀⠀⠀⠀⠀⠀⢠⠃⠀⡇⠀⠀⠀⠀⠀⢸⠀⠀⢇⠀⠀⠀⠀⠀⡇⠀│ │⠀⠀⠀⢠⠳⡀⠀⠀⠀⠀⠀⢠⠃⠀⢇⠀⠀⠀⠀⠀⡸⠀⠀⢱⠀⠀⠀⠀⠀⡇⠀⠀⢸⠀⠀⠀⠀⠀⡇⠀│ │⠀⠀⡠⠃⠀⢣⠀⠀⠀⠀⠀⡜⠀⠀⢸⠀⠀⠀⠀⠀⡇⠀⠀⠸⡀⠀⠀⠀⢀⠇⠀⠀⠸⡀⠀⠀⠀⢰â â €â”‚ │⠉⡹⠉⠉⠉⠉â¡â ‰â ‰â ‰â¢¹â ‰â ‰â ‰â ‰â¡â ‰â ‰â ‰â¢¹â ‰â ‰â ‰â ‰â¡â ‰â ‰â ‰â¢¹â ‰â ‰â ‰â ‰â¡â ‰â ‰â ‰â¢¹â ‰â ‰â”‚ │⡰â â €â €â €â €â ˜â¡„⠀⠀⡎⠀⠀⠀⠀⢸⠀⠀⠀⡜⠀⠀⠀⠀⢱⠀⠀⠀⡜⠀⠀⠀⠀⢇⠀⠀⠀⡜⠀⠀│ │â â €â €â €â €â €â €â¢±â €â¢°â â €â €â €â €â ˆâ¡†â €â¢€â ‡â €â €â €â €â¢¸â €â €â €â¡‡â €â €â €â €â¢¸â €â €â €â¡‡â €â €â”‚ │⠀⠀⠀⠀⠀⠀⠀⠀⢣⡇⠀⠀⠀⠀⠀⠀⢱⠀⢸⠀⠀⠀⠀⠀⠀⡇⠀⢰â â €â €â €â €â ¸â¡€â €â¢€â ‡â €â €â”‚ -25 │⠀⠀⠀⠀⠀⠀⠀⠀⠈⠀⠀⠀⠀⠀⠀⠀⠘⡄⡎⠀⠀⠀⠀⠀⠀⢣⠀⣸⠀⠀⠀⠀⠀⠀⡇⠀⢸⠀⠀⠀│ └────────────────────────────────────────┘ 1 10 red-data-tools-YouPlot-08da630/test/fixtures/simple-lineplot.txt000066400000000000000000000044511520446126500250100ustar00rootroot00000000000000 ┌────────────────────────────────────────┠50 │⠀⠀⠀⠀⠀⠀⠀⠀⠀⠀⠀⠀⠀⠀⠀⠀⠀⠀⠀⠀⠀⠀⠀⠀⠀⠀⠀⠀⠀⠀⠀⠀⠀⠀⠀⠀⠀⠀⠀⢸│ │⠀⠀⠀⠀⠀⠀⠀⠀⠀⠀⠀⠀⠀⠀⠀⠀⠀⠀⠀⠀⠀⠀⠀⠀⠀⠀⠀⠀⠀⠀⠀⡄⠀⠀⠀⠀⠀⠀⠀⡸│ │⠀⠀⠀⠀⠀⠀⠀⠀⠀⠀⠀⠀⠀⠀⠀⠀⠀⠀⠀⠀⠀⠀⠀⠀⠀⠀⠀⠀⠀⠀⢸⢇⠀⠀⠀⠀⠀⠀⠀⡇│ │⠀⠀⠀⠀⠀⠀⠀⠀⠀⠀⠀⠀⠀⠀⠀⠀⠀⠀⠀⠀⠀⢠⢇⠀⠀⠀⠀⠀⠀⠀⡎⢸⠀⠀⠀⠀⠀⠀⢠⠃│ │⠀⠀⠀⠀⠀⠀⠀⠀⠀⠀⠀⠀⠀⡄⠀⠀⠀⠀⠀⠀⠀⡜⢸⠀⠀⠀⠀⠀⠀⢠⠃⠈⡆⠀⠀⠀⠀⠀⢸⠀│ │⠀⠀⠀⠀⠀⠀⠀⠀⠀⠀⠀⠀⡸⠸⡀⠀⠀⠀⠀⠀⢠⠃⠀⡇⠀⠀⠀⠀⠀⢸⠀⠀⢇⠀⠀⠀⠀⠀⡎⠀│ │⠀⠀⠀⡠⠳⡀⠀⠀⠀⠀⠀⢠⠃⠀⢣⠀⠀⠀⠀⠀⡜⠀⠀⢱⠀⠀⠀⠀⠀⡇⠀⠀⢸⠀⠀⠀⠀⠀⡇⠀│ │⠤⢤⠼⠤⠤⠵⡤⠤⠤⠤⢤⠧⠤⠤⠼⡤⠤⠤⠤⢤⠧⠤⠤⠬⡦⠤⠤⠤⢴⠥⠤⠤⠬⡦⠤⠤⠤⢼⠤⠤│ │⡠⠃⠀⠀⠀⠀⠱⡀⠀⠀⡜⠀⠀⠀⠀⢱⠀⠀⠀⡸⠀⠀⠀⠀⢣⠀⠀⠀⡸⠀⠀⠀⠀⡇⠀⠀⠀⡜⠀⠀│ │â â €â €â €â €â €â €â ±â¡€â¡°â â €â €â €â €â €â¡‡â €â¢€â ‡â €â €â €â €â ¸â¡€â €â €â¡‡â €â €â €â €â¢¸â €â €â €â¡‡â €â €â”‚ │⠀⠀⠀⠀⠀⠀⠀⠀⠱⠃⠀⠀⠀⠀⠀⠀⠸⡀⡸⠀⠀⠀⠀⠀⠀⢇⠀⢸⠀⠀⠀⠀⠀⠘⡄⠀⢰â â €â €â”‚ │⠀⠀⠀⠀⠀⠀⠀⠀⠀⠀⠀⠀⠀⠀⠀⠀⠀⢇⠇⠀⠀⠀⠀⠀⠀⢸⠀⡎⠀⠀⠀⠀⠀⠀⡇⠀⢸⠀⠀⠀│ │⠀⠀⠀⠀⠀⠀⠀⠀⠀⠀⠀⠀⠀⠀⠀⠀⠀⠈⠀⠀⠀⠀⠀⠀⠀⠀⣇⠇⠀⠀⠀⠀⠀⠀⢸⠀⡇⠀⠀⠀│ │⠀⠀⠀⠀⠀⠀⠀⠀⠀⠀⠀⠀⠀⠀⠀⠀⠀⠀⠀⠀⠀⠀⠀⠀⠀⠀⠹⠀⠀⠀⠀⠀⠀⠀⠘⣄⠇⠀⠀⠀│ -50 │⠀⠀⠀⠀⠀⠀⠀⠀⠀⠀⠀⠀⠀⠀⠀⠀⠀⠀⠀⠀⠀⠀⠀⠀⠀⠀⠀⠀⠀⠀⠀⠀⠀⠀⠀⣿⠀⠀⠀⠀│ └────────────────────────────────────────┘ 1 10 red-data-tools-YouPlot-08da630/test/fixtures/simple-xyxy-odd.tsv000066400000000000000000000000321520446126500247330ustar00rootroot00000000000000x1 y1 x2 1 10 100 2 20 200red-data-tools-YouPlot-08da630/test/fixtures/simple.tsv000066400000000000000000000000431520446126500231520ustar00rootroot00000000000000-10 10 -20 20 -30 30 -40 40 -50 50 red-data-tools-YouPlot-08da630/test/fixtures/simpleT.tsv000066400000000000000000000000431520446126500232760ustar00rootroot00000000000000-10 10 -20 20 -30 30 -40 40 -50 50 red-data-tools-YouPlot-08da630/test/test_helper.rb000066400000000000000000000001531520446126500221170ustar00rootroot00000000000000# frozen_string_literal: true require 'simplecov' SimpleCov.start require 'youplot' require 'test/unit' red-data-tools-YouPlot-08da630/test/unicode_plot_test.rb000066400000000000000000000010101520446126500233150ustar00rootroot00000000000000# frozen_string_literal: true require_relative 'test_helper' require 'unicode_plot' # Check the UnicodePlot constants that YouPlot depends on. # Prepare for UnicodePlot version upgrades. class UnicodePlotTest < Test::Unit::TestCase test 'VERSION' do assert UnicodePlot::VERSION end test 'BORDER_MAP' do assert_instance_of Hash, UnicodePlot::BORDER_MAP end test 'PREDEFINED_TRANSFORM_FUNCTIONS' do assert_instance_of Hash, UnicodePlot::ValueTransformer::PREDEFINED_TRANSFORM_FUNCTIONS end end red-data-tools-YouPlot-08da630/test/youplot/000077500000000000000000000000001520446126500207705ustar00rootroot00000000000000red-data-tools-YouPlot-08da630/test/youplot/aggregation_test.rb000066400000000000000000000054701520446126500246510ustar00rootroot00000000000000# frozen_string_literal: true require_relative '../test_helper' class AggregationTest < Test::Unit::TestCase test :count_values do @m = YouPlot::Aggregation assert_equal([%i[a b c], [3, 2, 1]], @m.count_values(%i[a a a b b c])) assert_equal([%i[c b a], [3, 2, 1]], @m.count_values(%i[a b b c c c])) end test :count_values_natural_sort_integer_labels do @m = YouPlot::Aggregation assert_equal([%w[19 187 1765], [1, 1, 1]], @m.count_values(%w[1765 187 19])) end test :count_values_natural_sort_alnum_labels do @m = YouPlot::Aggregation assert_equal([%w[a1 a2 a10], [1, 1, 1]], @m.count_values(%w[a10 a2 a1])) end test :count_values_natural_sort_negative_numeric_labels do @m = YouPlot::Aggregation assert_equal([%w[-20 -10 10], [1, 1, 1]], @m.count_values(%w[-10 10 -20])) end test :count_values_natural_sort_chr_labels do @m = YouPlot::Aggregation assert_equal( [%w[chr1 chr2 chr10 chr11 chr12], [1, 1, 1, 1, 1]], @m.count_values(%w[chr12 chr1 chr11 chr10 chr2]) ) end test :count_values_natural_sort_text_only_labels do @m = YouPlot::Aggregation assert_equal([%w[chrM chrX chrY], [1, 1, 1]], @m.count_values(%w[chrY chrX chrM])) end test :count_values_natural_sort_leading_zeros do @m = YouPlot::Aggregation assert_equal([%w[01 1 2], [1, 1, 1]], @m.count_values(%w[2 1 01])) end test :count_values_natural_sort_mixed_numeric_and_text do @m = YouPlot::Aggregation assert_equal([%w[2 10 abc], [1, 1, 1]], @m.count_values(%w[abc 10 2])) end test :count_values_natural_sort_numeric_and_mixed_labels do @m = YouPlot::Aggregation assert_equal([%w[2 2a 10], [1, 1, 1]], @m.count_values(%w[10 2a 2])) end test :count_values_natural_sort_ipv4_labels do @m = YouPlot::Aggregation assert_equal( [%w[192.168.0.2 192.168.0.10 192.168.1.1], [1, 1, 1]], @m.count_values(%w[192.168.1.1 192.168.0.10 192.168.0.2]) ) end test :count_values_natural_sort_version_labels do @m = YouPlot::Aggregation assert_equal( [%w[1.2.3 1.2.10 1.10.0], [1, 1, 1]], @m.count_values(%w[1.10.0 1.2.10 1.2.3]) ) end test :count_values_mixed_counts_with_ties do @m = YouPlot::Aggregation # "a" appears 3 times (top), then "chr1" and "chr10" tie at 1 each assert_equal( [%w[a chr1 chr10], [3, 1, 1]], @m.count_values(%w[a a a chr10 chr1]) ) end test :count_values_reverse_preserves_semantics do @m = YouPlot::Aggregation assert_equal([%w[1765 187 19], [1, 1, 1]], @m.count_values(%w[1765 187 19], reverse: true)) end test :count_values_non_tally do @m = YouPlot::Aggregation assert_equal([%i[a b c], [3, 2, 1]], @m.count_values(%i[a a a b b c], tally: false)) assert_equal([%i[c b a], [3, 2, 1]], @m.count_values(%i[a b b c c c], tally: false)) end end red-data-tools-YouPlot-08da630/test/youplot/dsv_test.rb000066400000000000000000000117121520446126500231520ustar00rootroot00000000000000# frozen_string_literal: true require_relative '../test_helper' class YouPlotDSVTest < Test::Unit::TestCase def setup @m = YouPlot::DSV end test :transpose2 do n = nil assert_equal([[1, 2, 3], [4, 5, 6], [7, 8, 9]], @m.transpose2([[1, 4, 7], [2, 5, 8], [3, 6, 9]])) assert_equal([[1, 2, 3], [4, 5, n], [6, n, n]], @m.transpose2([[1, 4, 6], [2, 5], [3]])) assert_equal([[1, 2, 3], [n, 4, 5], [n, n, 6]], @m.transpose2([[1], [2, 4], [3, 5, 6]])) end test :get_headers do assert_equal([1, 4, 7], @m.get_headers([[1, 2, 3], [4, 5, 6], [7, 8, 9]], true, true)) assert_equal([1, 2, 3], @m.get_headers([[1, 4, 6], [2, 5], [3]], true, true)) assert_equal([1, 2, 3], @m.get_headers([[1], [2, 4], [3, 5, 6]], true, true)) assert_equal([1, 2, 3], @m.get_headers([[1, 2, 3], [4, 5, 6], [7, 8, 9]], true, false)) assert_equal([1, 4, 6], @m.get_headers([[1, 4, 6], [2, 5], [3]], true, false)) assert_equal([1], @m.get_headers([[1], [2, 4], [3, 5, 6]], true, false)) assert_equal(nil, @m.get_headers([[1, 2, 3], [4, 5, 6], [7, 8, 9]], false, true)) assert_equal(nil, @m.get_headers([[1, 2, 3], [4, 5, 6], [7, 8, 9]], false, false)) assert_equal([1, 2, 3], @m.get_headers([[1, 2, 3]], true, false)) end test :get_series do n = nil assert_equal([[2, 3], [5, 6], [8, 9]], @m.get_series([[1, 2, 3], [4, 5, 6], [7, 8, 9]], true, true)) assert_equal([[4, 6], [5], []], @m.get_series([[1, 4, 6], [2, 5], [3]], true, true)) assert_equal([[], [4], [5, 6]], @m.get_series([[1], [2, 4], [3, 5, 6]], true, true)) assert_equal([[4, 7], [5, 8], [6, 9]], @m.get_series([[1, 2, 3], [4, 5, 6], [7, 8, 9]], true, false)) assert_equal([[2, 3], [5, nil]], @m.get_series([[1, 4, 6], [2, 5], [3]], true, false)) assert_equal([[2, 3], [4, 5], [nil, 6]], @m.get_series([[1], [2, 4], [3, 5, 6]], true, false)) assert_equal([[1, 2, 3], [4, 5, 6], [7, 8, 9]], @m.get_series([[1, 2, 3], [4, 5, 6], [7, 8, 9]], false, true)) assert_equal([[1, 4, 6], [2, 5], [3]], @m.get_series([[1, 4, 6], [2, 5], [3]], false, true)) assert_equal([[1], [2, 4], [3, 5, 6]], @m.get_series([[1], [2, 4], [3, 5, 6]], false, true)) assert_equal([[1, 4, 7], [2, 5, 8], [3, 6, 9]], @m.get_series([[1, 2, 3], [4, 5, 6], [7, 8, 9]], false, false)) assert_equal([[1, 2, 3], [4, 5, n], [6, n, n]], @m.get_series([[1, 4, 6], [2, 5], [3]], false, false)) assert_equal([[1, 2, 3], [n, 4, 5], [n, n, 6]], @m.get_series([[1], [2, 4], [3, 5, 6]], false, false)) assert_equal([[], [], []], @m.get_series([[1, 2, 3]], true, false)) end end red-data-tools-YouPlot-08da630/test/youplot/integer_test.rb000066400000000000000000000022751520446126500240170ustar00rootroot00000000000000# frozen_string_literal: true require 'tempfile' require_relative '../test_helper' class YouPlotIntegerTest < Test::Unit::TestCase class << self def startup @stdin = $stdin.dup @stdout = $stdout.dup @stderr = $stderr.dup end def shutdown $stdin = @stdin $stdout = @stdout $stderr = @stderr end end def setup @stderr_file = Tempfile.new @stdout_file = Tempfile.new $stderr = @stderr_file $stdout = @stdout_file end def teardown @stderr_file.close @stdout_file.close end def fixture(fname) File.read(File.expand_path("../fixtures/#{fname}", __dir__)) end # Issue #44: When all values are integers, display without decimal points test :barplot_integer_values do $stdin = File.open(File.expand_path('../fixtures/integer.tsv', __dir__), 'r') YouPlot::Command.new(['bar']).run assert_equal fixture('integer-barplot.txt'), @stderr_file.read end test :barplot_float_values do $stdin = File.open(File.expand_path('../fixtures/integer-like-float.tsv', __dir__), 'r') YouPlot::Command.new(['bar']).run assert_equal fixture('integer-like-float-barplot.txt'), @stderr_file.read end end red-data-tools-YouPlot-08da630/test/youplot/iris_test.rb000066400000000000000000000123321520446126500233230ustar00rootroot00000000000000# frozen_string_literal: true require 'tempfile' require_relative '../test_helper' class YouPlotIRISTest < Test::Unit::TestCase class << self def startup @stdin = $stdin.dup @stdout = $stdout.dup @stderr = $stderr.dup end def shutdown $stdin = @stdin $stdout = @stdout $stderr = @stderr end end def setup $stdin = File.open(File.expand_path('../fixtures/iris.csv', __dir__), 'r') @stderr_file = Tempfile.new @stdout_file = Tempfile.new $stderr = @stderr_file $stdout = @stdout_file end def teardown @stderr_file.close @stdout_file.close end def fixture(fname) File.read(File.expand_path("../fixtures/#{fname}", __dir__)) end test :barplot do YouPlot::Command.new(['barplot', '-H', '-d,', '-t', 'IRIS-BARPLOT']).run assert_equal fixture('iris-barplot.txt'), @stderr_file.read end # barplot doesn't make sense, but just to make sure it works. test :bar do YouPlot::Command.new(['bar', '-H', '-d,', '-t', 'IRIS-BARPLOT']).run assert_equal fixture('iris-barplot.txt'), @stderr_file.read end test :histogram do YouPlot::Command.new(['histogram', '-H', '-d,', '-t', 'IRIS-HISTOGRAM']).run assert_equal fixture('iris-histogram.txt'), @stderr_file.read end test :hist do YouPlot::Command.new(['hist', '-H', '-d,', '-t', 'IRIS-HISTOGRAM']).run assert_equal fixture('iris-histogram.txt'), @stderr_file.read end # Yeah, lineplot/lineplots don't make sense too. test :lineplot do YouPlot::Command.new(['lineplot', '-H', '-d,', '-t', 'IRIS-LINEPLOT']).run assert_equal fixture('iris-lineplot.txt'), @stderr_file.read end test :line do YouPlot::Command.new(['line', '-H', '-d,', '-t', 'IRIS-LINEPLOT']).run assert_equal fixture('iris-lineplot.txt'), @stderr_file.read end # l is an undocumented alias of lineplot. test :l do YouPlot::Command.new(['l', '-H', '-d,', '-t', 'IRIS-LINEPLOT']).run assert_equal fixture('iris-lineplot.txt'), @stderr_file.read end test :lineplots do YouPlot::Command.new(['lineplots', '-H', '-d,', '-t', 'IRIS-LINEPLOTS']).run assert_equal fixture('iris-lineplots.txt'), @stderr_file.read end test :lines do YouPlot::Command.new(['lines', '-H', '-d,', '-t', 'IRIS-LINEPLOTS']).run assert_equal fixture('iris-lineplots.txt'), @stderr_file.read end # ls is an undocumented alias of lineplots. test :ls do YouPlot::Command.new(['ls', '-H', '-d,', '-t', 'IRIS-LINEPLOTS']).run assert_equal fixture('iris-lineplots.txt'), @stderr_file.read end test :scatter do YouPlot::Command.new(['scatter', '-H', '-d,', '-t', 'IRIS-SCATTER']).run assert_equal fixture('iris-scatter.txt'), @stderr_file.read end test :s do YouPlot::Command.new(['s', '-H', '-d,', '-t', 'IRIS-SCATTER']).run assert_equal fixture('iris-scatter.txt'), @stderr_file.read end test :density do YouPlot::Command.new(['density', '-H', '-d,', '-t', 'IRIS-DENSITY']).run assert_equal fixture('iris-density.txt'), @stderr_file.read end test :d do YouPlot::Command.new(['d', '-H', '-d,', '-t', 'IRIS-DENSITY']).run assert_equal fixture('iris-density.txt'), @stderr_file.read end test :boxplot do YouPlot::Command.new(['boxplot', '-H', '-d,', '-t', 'IRIS-BOXPLOT']).run assert_equal fixture('iris-boxplot.txt'), @stderr_file.read end test :box do YouPlot::Command.new(['box', '-H', '-d,', '-t', 'IRIS-BOXPLOT']).run assert_equal fixture('iris-boxplot.txt'), @stderr_file.read end # Yeah, lineplot/lineplots don't make sense too. # Just checking the behavior. test :c do YouPlot::Command.new(['count', '-H', '-d,']).run assert_equal fixture('iris-count.txt'), @stderr_file.read end test :count do YouPlot::Command.new(['c', '-H', '-d,']).run assert_equal fixture('iris-count.txt'), @stderr_file.read end # Output options. test :plot_output_stdout do YouPlot::Command.new(['bar', '-o', '-H', '-d,', '-t', 'IRIS-BARPLOT']).run assert_equal '', @stderr_file.read assert_equal fixture('iris-barplot.txt'), @stdout_file.read end test :data_output_stdout do YouPlot::Command.new(['bar', '-O', '-H', '-d,', '-t', 'IRIS-BARPLOT']).run assert_equal fixture('iris-barplot.txt'), @stderr_file.read assert_equal fixture('iris.csv'), @stdout_file.read end %i[colors color colours colour].each do |cmd_name| test cmd_name do YouPlot::Command.new([cmd_name.to_s]).run assert_equal fixture('colors.txt'), @stderr_file.read assert_equal '', @stdout_file.read end end test :colors_output_stdout do YouPlot::Command.new(['colors', '-o']).run assert_equal '', @stderr_file.read assert_equal fixture('colors.txt'), @stdout_file.read end test :unrecognized_command do assert_raise(YouPlot::Parser::Error) do YouPlot::Command.new(['abracadabra', '--hadley', '--wickham']).run end assert_equal '', @stderr_file.read assert_equal '', @stdout_file.read end test :encoding do $stdin = File.open(File.expand_path('../fixtures/iris_utf16.csv', __dir__), 'r') YouPlot::Command.new(['s', '--encoding', 'UTF-16', '-H', '-d,', '-t', 'IRIS-SCATTER']).run assert_equal fixture('iris-scatter.txt'), @stderr_file.read end end red-data-tools-YouPlot-08da630/test/youplot/parser_test.rb000066400000000000000000000064771520446126500236660ustar00rootroot00000000000000# frozen_string_literal: true require 'tempfile' require 'tmpdir' require 'stringio' require_relative '../test_helper' class YouPlotParserTest < Test::Unit::TestCase def setup # find_config_file sets MYYOUPLOTRC as a side effect; isolate tests. @original_myyouplotrc = ENV['MYYOUPLOTRC'] ENV.delete('MYYOUPLOTRC') end def teardown # Restore to avoid leaking into other tests. if @original_myyouplotrc.nil? ENV.delete('MYYOUPLOTRC') else ENV['MYYOUPLOTRC'] = @original_myyouplotrc end end def with_temp_config(content) Tempfile.create(['youplot', '.yml']) do |file| file.write(content) file.flush yield file.path end end def capture_stdout original_stdout = $stdout stdout = StringIO.new $stdout = stdout yield stdout.string ensure $stdout = original_stdout end def with_stdout(stdout) original_stdout = $stdout $stdout = stdout yield ensure $stdout = original_stdout end test :cli_overrides_config_file_values do with_temp_config(<<~YAML) do |config_path| width: 80 labels: true delimiter: "," fmt: yx YAML parser = YouPlot::Parser.new parser.parse_options(['line', '--config', config_path, '--no-labels', '-w', '40', '--fmt', 'xy']) assert_equal 40, parser.params.width assert_equal false, parser.params.labels assert_equal ',', parser.options.delimiter assert_equal 'xy', parser.options.fmt end end test :explicit_config_file_overrides_default_search do Dir.mktmpdir do |dir| Dir.chdir(dir) do # Create a config file in the current directory File.write('.youplot.yml', "width: 10\n") # Explicitly specify a different config file with_temp_config("width: 80\n") do |config_path| parser = YouPlot::Parser.new parser.parse_options(['line', "--config=#{config_path}"]) assert_equal 80, parser.params.width end end end end test :show_config_info_uses_explicit_config_file do with_temp_config("width: 80\n") do |config_path| parser = YouPlot::Parser.new parser.parse_options(['line', "--config=#{config_path}"]) output = capture_stdout do parser.show_config_info end assert_include output, "config file : #{config_path}" # Hash#inspect format differs by Ruby version: # `"key" => val` (< 3.0) vs `"key"=>val` (>= 3.0) assert_match(/"width"\s*=>\s*80/, output) end end test :show_config_info_finds_default_config_file do Dir.mktmpdir do |dir| Dir.chdir(dir) do File.write('.youplot.yml', "width: 42\n") parser = YouPlot::Parser.new output = capture_stdout do parser.show_config_info end assert_include output, 'config file : ' assert_include output, '.youplot.yml' assert_match(/"width"\s*=>\s*42/, output) end end end test :config_hyphen_output_uses_stdout do stdout = StringIO.new with_stdout(stdout) do with_temp_config(%("output": "-"\n"pass": "-"\n)) do |config_path| parser = YouPlot::Parser.new parser.parse_options(['line', "--config=#{config_path}"]) assert_same stdout, parser.options.output assert_same stdout, parser.options.pass end end end end red-data-tools-YouPlot-08da630/test/youplot/progressive_test.rb000066400000000000000000000065151520446126500247330ustar00rootroot00000000000000# frozen_string_literal: true require 'stringio' require_relative '../test_helper' class YouPlotProgressiveTest < Test::Unit::TestCase def build_options(overrides = {}) out = StringIO.new defaults = YouPlot::Options::DEFAULTS.merge(output: out, pass: false) options_hash = defaults.merge(overrides) YouPlot::Options.new(*YouPlot::Options.members.map { |k| options_hash[k] }) end def build_data_with_progressive(command, lines) data = nil lines.each do |line| row = command.send(:parse_progressive_row, line) next if row.nil? data = command.send(:progressive_update_data, row) end data end def suppress_stderr stderr = $stderr $stderr = StringIO.new yield ensure $stderr = stderr end test 'progressive incremental parsing without headers matches DSV.parse' do command = YouPlot::Command.new([]) command.options = build_options(delimiter: "\t", headers: false, transpose: false) lines = %W[1\t2\n 3\n \n] actual = build_data_with_progressive(command, lines) expected = YouPlot::DSV.parse(lines.join, "\t", false, false) assert_equal expected.headers, actual.headers assert_equal expected.series, actual.series assert_nil command.instance_variable_get(:@raw_data) end test 'progressive incremental parsing with headers waits for first data row' do command = YouPlot::Command.new([]) command.options = build_options(delimiter: "\t", headers: true, transpose: false) header_row = command.send(:parse_progressive_row, "h1\th2\n") first = command.send(:progressive_update_data, header_row) assert_nil first data_row = command.send(:parse_progressive_row, "1\t2\n") actual = command.send(:progressive_update_data, data_row) expected = YouPlot::DSV.parse("h1\th2\n1\t2\n", "\t", true, false) assert_equal expected.headers, actual.headers assert_equal expected.series, actual.series end test 'progressive incremental parsing with headers and transpose matches DSV.parse' do command = YouPlot::Command.new([]) command.options = build_options(delimiter: "\t", headers: true, transpose: true) lines = %W[h1\t1\t2\n h2\t3\t4\n] actual = build_data_with_progressive(command, lines) expected = YouPlot::DSV.parse(lines.join, "\t", true, true) assert_equal expected.headers, actual.headers assert_equal expected.series, actual.series end test 'progressive with headers returns nil when headers are fewer than series' do command = YouPlot::Command.new([]) command.options = build_options(delimiter: "\t", headers: true, transpose: false) lines = %W[h1\n 1\t2\n] actual = nil expected = nil suppress_stderr do actual = build_data_with_progressive(command, lines) expected = YouPlot::DSV.parse(lines.join, "\t", true, false) end assert_nil expected assert_nil actual end test 'progressive with headers returns nil when headers are greater than series' do command = YouPlot::Command.new([]) command.options = build_options(delimiter: "\t", headers: true, transpose: false) lines = %W[h1\th2\n 1\n] actual = nil expected = nil suppress_stderr do actual = build_data_with_progressive(command, lines) expected = YouPlot::DSV.parse(lines.join, "\t", true, false) end assert_nil expected assert_nil actual end end red-data-tools-YouPlot-08da630/test/youplot/simple_test.rb000066400000000000000000000226241520446126500236530ustar00rootroot00000000000000# frozen_string_literal: true require 'tempfile' require 'tmpdir' require_relative '../test_helper' class YouPlotSimpleTest < Test::Unit::TestCase class << self def startup @stdin = $stdin.dup @stdout = $stdout.dup @stderr = $stderr.dup end def shutdown $stdin = @stdin $stdout = @stdout $stderr = @stderr end end def setup $stdin = File.open(File.expand_path('../fixtures/simple.tsv', __dir__), 'r') @stderr_file = Tempfile.new @stdout_file = Tempfile.new $stderr = @stderr_file $stdout = @stdout_file end def teardown @stderr_file.close @stdout_file.close end def fixture(fname) File.read(File.expand_path("../fixtures/#{fname}", __dir__)) end # Single command # The goal is to verify that the command works without any options. test :barplot do assert_raise(ArgumentError) do YouPlot::Command.new(['barplot']).run end end test :bar do assert_raise(ArgumentError) do YouPlot::Command.new(['bar']).run end end test :histogram do YouPlot::Command.new(['histogram']).run assert_equal fixture('simple-histogram.txt'), @stderr_file.read end test :hist do YouPlot::Command.new(['hist']).run assert_equal fixture('simple-histogram.txt'), @stderr_file.read end test :lineplot do YouPlot::Command.new(['lineplot']).run assert_equal fixture('simple-lineplot.txt'), @stderr_file.read end test :line do YouPlot::Command.new(['line']).run assert_equal fixture('simple-lineplot.txt'), @stderr_file.read end test :lineplots do assert_raise(YouPlot::Backends::UnicodePlot::Error) do YouPlot::Command.new(['lineplots']).run end end test :lineplots_fmt_xyxy_odd_series do $stdin = File.open(File.expand_path('../fixtures/simple-xyxy-odd.tsv', __dir__), 'r') assert_raise(YouPlot::Backends::UnicodePlot::Error) do YouPlot::Command.new(['lineplots', '--fmt', 'xyxy', '-H']).run end end test :lineplots_progressive_restores_cursor_on_error do $stdin = File.open(File.expand_path('../fixtures/simple-xyxy-odd.tsv', __dir__), 'r') assert_raise(YouPlot::Backends::UnicodePlot::Error) do YouPlot::Command.new(['lineplots', '--fmt', 'xyxy', '-H', '-p']).run end @stderr_file.rewind output = @stderr_file.read assert_include output, "\e[?25l" assert_include output, "\e[?25h" assert_include output, "\e[0J" end test :line_progressive_moves_below_plot_before_cleanup do YouPlot::Command.new(['line', '-p']).run @stderr_file.rewind output = @stderr_file.read # Cleanup sequence at the end of progressive mode: # - \e[\d+E : move cursor below the last rendered plot # - \e[0J : clear from cursor to end of screen # - \e[?25h : show cursor again assert_match(/\e\[\d+E\e\[0J\e\[\?25h\z/, output) end test :lines do assert_raise(YouPlot::Backends::UnicodePlot::Error) do YouPlot::Command.new(['lines']).run end end test :scatter do assert_raise(YouPlot::Backends::UnicodePlot::Error) do YouPlot::Command.new(['scatter']).run end end test :s do assert_raise(YouPlot::Backends::UnicodePlot::Error) do YouPlot::Command.new(['s']).run end end test :density do assert_raise(YouPlot::Backends::UnicodePlot::Error) do YouPlot::Command.new(['density']).run end end test :d do assert_raise(YouPlot::Backends::UnicodePlot::Error) do YouPlot::Command.new(['d']).run end end test :boxplot do YouPlot::Command.new(['boxplot']).run assert_equal fixture('simple-boxplot.txt'), @stderr_file.read end test :box do YouPlot::Command.new(['box']).run assert_equal fixture('simple-boxplot.txt'), @stderr_file.read end test :count do YouPlot::Command.new(['c']).run assert_equal fixture('simple-count.txt'), @stderr_file.read end test :c do YouPlot::Command.new(['count']).run assert_equal fixture('simple-count.txt'), @stderr_file.read end test :plot_output_stdout do YouPlot::Command.new(['line', '-o']).run assert_equal '', @stderr_file.read assert_equal fixture('simple-lineplot.txt'), @stdout_file.read end test :plot_output_hyphen_stdout do Dir.mktmpdir do |dir| Dir.chdir(dir) do YouPlot::Command.new(['line', '-o', '-', '-w', '17']).run assert_equal '', @stderr_file.read assert_equal fixture('simple-lineplot-width-17.txt'), @stdout_file.read assert_false File.exist?('-') end end end test :data_output_stdout do YouPlot::Command.new(['box', '-O']).run assert_equal fixture('simple-boxplot.txt'), @stderr_file.read assert_equal fixture('simple.tsv'), @stdout_file.read end test :data_output_hyphen_stdout do Dir.mktmpdir do |dir| Dir.chdir(dir) do YouPlot::Command.new(['box', '-O', '-', '-t', 'BOX']).run assert_include @stderr_file.read, 'BOX' assert_equal fixture('simple.tsv'), @stdout_file.read assert_false File.exist?('-') end end end test :line_transpose do $stdin = File.open(File.expand_path('../fixtures/simpleT.tsv', __dir__), 'r') YouPlot::Command.new(['line', '--transpose']).run assert_equal fixture('simple-lineplot.txt'), @stderr_file.read end test :line_T do $stdin = File.open(File.expand_path('../fixtures/simpleT.tsv', __dir__), 'r') YouPlot::Command.new(['line', '-T']).run assert_equal fixture('simple-lineplot.txt'), @stderr_file.read end test :line_xlabel do YouPlot::Command.new(['line', '--xlabel', 'X-LABEL']).run assert_equal fixture('simple-lineplot-xlabel.txt'), @stderr_file.read end test :line_ylabel do YouPlot::Command.new(['line', '--ylabel', 'Y-LABEL']).run assert_equal fixture('simple-lineplot-ylabel.txt'), @stderr_file.read end test :line_width do YouPlot::Command.new(['line', '--width', '17']).run assert_equal fixture('simple-lineplot-width-17.txt'), @stderr_file.read end test :line_w do YouPlot::Command.new(['line', '-w', '17']).run assert_equal fixture('simple-lineplot-width-17.txt'), @stderr_file.read end test :line_height do YouPlot::Command.new(['line', '--height', '17']).run assert_equal fixture('simple-lineplot-height-17.txt'), @stderr_file.read end test :line_h do YouPlot::Command.new(['line', '-h', '17']).run assert_equal fixture('simple-lineplot-height-17.txt'), @stderr_file.read end test :line_margin do YouPlot::Command.new(['line', '--margin', '17']).run assert_equal fixture('simple-lineplot-margin-17.txt'), @stderr_file.read end test :line_m do YouPlot::Command.new(['line', '-m', '17']).run assert_equal fixture('simple-lineplot-margin-17.txt'), @stderr_file.read end test :line_padding do YouPlot::Command.new(['line', '--padding', '17']).run assert_equal fixture('simple-lineplot-padding-17.txt'), @stderr_file.read end test :line_border_corners do YouPlot::Command.new(['line', '--border', 'corners']).run assert_equal fixture('simple-lineplot-border-corners.txt'), @stderr_file.read end test :line_b_corners do YouPlot::Command.new(['line', '-b', 'corners']).run assert_equal fixture('simple-lineplot-border-corners.txt'), @stderr_file.read end test :line_border_barplot do YouPlot::Command.new(['line', '--border', 'barplot']).run assert_equal fixture('simple-lineplot-border-barplot.txt'), @stderr_file.read end test :line_b_barplot do YouPlot::Command.new(['line', '-b', 'barplot']).run assert_equal fixture('simple-lineplot-border-barplot.txt'), @stderr_file.read end test :line_canvas_ascii do YouPlot::Command.new(['line', '--canvas', 'ascii']).run assert_equal fixture('simple-lineplot-canvas-ascii.txt'), @stderr_file.read end test :line_canvas_braille do YouPlot::Command.new(['line', '--canvas', 'braille']).run assert_equal fixture('simple-lineplot.txt'), @stderr_file.read end test :line_canvas_density do YouPlot::Command.new(['line', '--canvas', 'density']).run assert_equal fixture('simple-lineplot-canvas-density.txt'), @stderr_file.read end test :line_canvas_dot do YouPlot::Command.new(['line', '--canvas', 'dot']).run assert_equal fixture('simple-lineplot-canvas-dot.txt'), @stderr_file.read end # test :line_canvas_block do # YouPlot::Command.new(['line', '--canvas', 'block']).run # assert_equal fixture('simple-lineplot-canvas-dot.txt'), @stderr_file.read # end test :hist_symbol_atmark do YouPlot::Command.new(['hist', '--symbol', '@']).run assert_equal fixture('simple-histogram-symbol-@.txt'), @stderr_file.read end test :line_xlim do YouPlot::Command.new(['line', '--xlim', '-1,5']).run assert_equal fixture('simple-lineplot-xlim--1-5.txt'), @stderr_file.read end test :line_ylim do YouPlot::Command.new(['line', '--ylim', '-25,50']).run assert_equal fixture('simple-lineplot-ylim--25-50.txt'), @stderr_file.read end test :line_xlim_and_ylim do YouPlot::Command.new(['line', '--xlim', '-1,5', '--ylim', '-25,50']).run assert_equal fixture('simple-lineplot-xlim--1-5-ylim--25-50.txt'), @stderr_file.read end test :line_grid do YouPlot::Command.new(['line', '--grid']).run assert_equal fixture('simple-lineplot.txt'), @stderr_file.read end test :line_no_grid do YouPlot::Command.new(['line', '--no-grid']).run assert_equal fixture('simple-lineplot-no-grid.txt'), @stderr_file.read end end red-data-tools-YouPlot-08da630/test/youplot_test.rb000066400000000000000000000010201520446126500223450ustar00rootroot00000000000000# frozen_string_literal: true require_relative 'test_helper' class YouPlotTest < Test::Unit::TestCase def teardown YouPlot.run_as_executable = false end test :it_has_a_version_number do assert_kind_of String, ::YouPlot::VERSION end test :run_as_executable do assert_equal false, YouPlot.run_as_executable assert_equal false, YouPlot.run_as_executable? YouPlot.run_as_executable = true assert_equal true, YouPlot.run_as_executable assert_equal true, YouPlot.run_as_executable? end end red-data-tools-YouPlot-08da630/youplot.gemspec000066400000000000000000000014471520446126500213640ustar00rootroot00000000000000# frozen_string_literal: true require_relative 'lib/youplot/version' Gem::Specification.new do |spec| spec.name = 'youplot' spec.version = YouPlot::VERSION spec.authors = ['kojix2'] spec.email = ['2xijok@gmail.com'] spec.summary = 'A command line tool for Unicode Plotting' spec.description = 'A command line tool for Unicode Plotting' spec.homepage = 'https://github.com/red-data-tools/YouPlot' spec.license = 'MIT' spec.required_ruby_version = Gem::Requirement.new('>= 2.5.0') spec.files = Dir['*.{md,txt}', 'logo.svg', '{lib,exe,sig}/**/*'] spec.bindir = 'exe' spec.executables = %w[uplot youplot] spec.require_paths = ['lib'] spec.add_dependency 'csv' spec.add_dependency 'unicode_plot', '>= 0.0.5' end